
 New York Bay and Harbor and the Environs
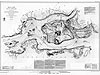 Hell Gate and Its Approaches
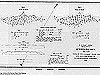 Pot Rock and Way's Reef, Hell Gate
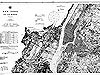 New York Bay and Harbor
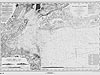
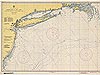 Approaches to New York
 New York Harbor, Upper Bay and Narrows
 Harlem River Nautical
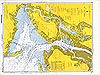 New York Harbor Nautical
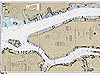 Hudson and East Rivers
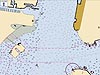 New York City Electronic Navigational Chart
Hudson and East Rivers
This nautical chart, published in 2000, depicts the Hudson and East Rivers, from Governors Island to 67th Street. This is the last chart to depict the World Trade Center, which was destroyed during the terrorist attacks on September 11, 2001.
You may need to download the Flash Player. View the non-Flash version of Hudson and East Rivers (TIF 177.8MB).
This chart had several features not included on earlier charts in this collection. For example, it lists a telephone number that mariners should call to report pollution spills and it shows the locations of navigational hazards such as submarine pipelines and cables.
As a reflection of the power of changing technology, this chart is also the first in this collection to refer mariners to a NOAA Weather Radio broadcast frequency. NOAA Weather Radio is a nationwide network of radio stations broadcasting National Weather Service warnings, watches, forecasts, and other hazard information 24 hours a day. The National Weather Service also uses this system to broadcast weather...with the push of a button mariners can get current weather conditions and forecasts for their areas, any time, day or night. Earlier nautical charts in this collection directed mariners to storm warnings posted on stations around New York Harbor.
You'll see a note indicating that this chart is based on NAD83. "NAD83" stands for the North American Datum of 1983. Geodetic datums define the size and shape of the Earth and the origin and orientation of the coordinate systems used to map the Earth. A datum can be considered as an arbitrary zero level, or a reference, of the geospatial data's "coordinate system." NAD83 is the horizontal control datum for the United States, Canada, Mexico, and Central America.
Historic Reference
The terrorist attacks on September 11, 2001, forever changed the New York City skyline. This nautical chart, published in 2000, is the last edition of this chart showing the World Trade Center. The twin towers of the World Trade Center stood at approximately 40°42'N, 73°59'W.
- Chart title: Hudson and East Rivers
- Author: NOAA, National Ocean Service, Office of Coast Survey
- Contributors: U.S. Army Corps of Engineers and U.S. Coast Guard (revisions and additions)
- Year published: 2000
- Scale: 1:10,000
- Material: Paper
- Printing technology: Photolithography
- Hydrographic survey technology: Multi-beam ecosounder
Related Web Sites
Office of Coast Survey: Historical Map and Chart Collection
National Ocean Service Education Geodesy Discovery Kit
Works Consulted
National Geodetic Survey. (2006). NGS FAQs. Retrieved June 20, 2006, from: http://www.ngs.noaa.gov/faq.shtml.
National Weather Service. (2006). NOAA Weather Radio All Hazards Web site. Retrieved June 20, 2006, from: http://www.weather.gov/nwr/.
(top)