Aviation Weather Forecasting: A History of Enhancing Air Flight Safety
Every day, dangerous weather conditions can delay and cancel airline flights, and severe weather can turn a flight into a threatening experience. Each year more than one-quarter to one-half of all aviation accidents are weather related. Economic losses due to aviation delays caused by weather are estimated at more than $1 billion per year. NOAA’s Aviation Weather Center issues warnings of hazardous conditions within the domestic and international airspace and issues aviation weather forecasts and analyses to save lives, protect property, and enhance commerce.
- Introduction
- Getting Off the Ground
- Today's Forecasting Centers
- Today's Tools and Products
- Conclusion
Within nine years of the Wright brothers' short 1903 excursion into the thin air of powered flight, aviation weather became a staple of weather forecasting. Just as the mechanics and technology of aviation have grown by leaps and bounds, so too has the federal government's effort to provide critical weather information to pilots and those who support them.
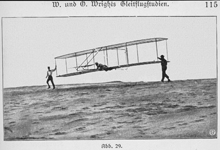
Shortly after the famed first flight by brothers Orville and Wilbur Wright in 1903, the need for aviation weather forecasting also took off. Click image for larger view.
Weather information has always been important to the citizenry of the United States, and never more so than after the Wright brothers' accomplishment at Kitty Hawk, North Carolina.
This article takes a look at the history of aviation weather forecasting, starting in the early 1900s, and concludes by reviewing the tools and techniques used by NOAA's National Weather Service today to enhance the safety of airplane travel.
Getting Off the Ground
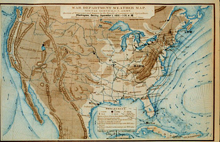
An early Signal Service weather map from September 1, 1872, on record in the NOAA Library. Careful compilation and study of these maps led to scientific forecasting. Click image for larger view.
While weather observation networks began to grow during the mid-1800s, actually getting collected information to others was a major chore. It was not until the advent of the telegraph in 1869 that "high speed" weather transmission became a reality. Ensuing years saw creation of the radio, teletype, television, satellites, computers, and all manner of modern marvels created to speed communication even more. Daring innovators pushed the barriers of air travel and the government pushed the collection and dissemination of weather data to enhance the level of safety for those travelers taking to the skies.
Enter the Weather Bureau
In 1911, just eight years after that first manned flight by the Wright brothers, C.P. Rogers completed the first transcontinental airplane flight, spending 87 hours and four minutes over 18 days to fly from New York City to Pasadena, California. Three years later, the U.S. Weather Bureau, the predecessor agency to NOAA’s National Weather Service, established an aerological section to provide weather forecasts specifically to meet the growing needs of aviation.
Aviation weather passed two major milestones in 1918. First, the Weather Bureau began issuing bulletins and forecasts for domestic military flights and new air mail routes. And, on December 1, 1918, the Weather Bureau issued its first aviation weather forecast — for the Aerial Mail Service route from New York to Chicago.
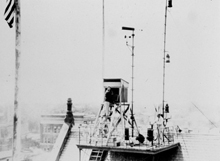
A meteorologist reads the temperature from a thermometer on top of a Weather Bureau facility in 1925. Click image for larger view.
Recognizing the important connection between weather forecasting and aviation, on May 20, 1926, Congress passed the Air Commerce Act. This Act included legislation directing the Weather Bureau to "furnish weather reports, forecasts, warnings ... to promote the safety and efficiency of air navigation in the United States."
"Back then, the early forecasters knew little about weather phenomena that affect aviation: thunderstorms, fog, low clouds, icing, and turbulence," said Jack May, director of the NOAA's Aviation Weather Center in Kansas City, Missouri. "Most of the effort was to find out what was happening, not what would happen. The taking of weather observations was mostly surface-based. There was no way to gather accurate information from the sky other than tracking a balloon or hearing reports from pilots after they landed."
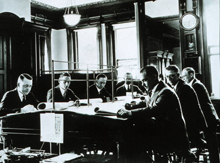
The Weather Bureau Forecast Office, 1926. Click image for larger view.
Over the years, this would change as technology evolved. For example, in 1931, the Weather Bureau began regular 5 a.m. aircraft observations at Chicago, Cleveland, Dallas, and Omaha at altitudes reaching 16,000 feet (4,875 meters). The use of regular aircraft to monitor aviation weather spelled the demise of the technique of using "kite stations" to collect weather information.
The first official Weather Bureau radio meteorograph, or radiosonde, sounding was made at East Boston, Massachusetts, in 1937. Radiosondes are units for use in weather balloons that measure various atmospheric parameters, such as air temperature, humidity, and pressure and transmit them to a fixed receiver on the ground. Two years later, the use of radiosondes would replace all military and Weather Bureau aircraft observations.
Radar entered the forecasting picture in 1942, when the U.S. Navy gave the Weather Bureau 25 surplus aircraft radars. These radars were modified for ground meteorological use, marking the start of a weather radar system in the U.S.
Today's Aviation Weather Forecasting Centers
Today, where to fly or whether to fly are decisions pilots and air traffic planners make thousands of times a day. Record numbers of commercial flights have crisscrossed American skies in recent years, and the aviation industry expects the numbers to increase. The latest weather forecast and current conditions are crucial in making the right decisions about whether to fly or land.
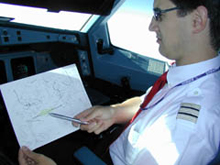
The latest weather forecast is crucial for both pilots and air traffic controllers in making the right decisions about whether to fly or not. NOAA's National Weather Service uses a combination of high-technology and skilled meteorologists to develop aviation weather forecasts for each flight in the United States.
NOAA's National Weather Service uses a combination of state-of-the-art technology and skilled meteorologists to develop aviation weather forecasts for flights over the United States, as well as for air traffic around the globe.
Forecasters at a variety of National Weather Service offices comprise the aviation weather forecast team, including meteorologists at 122 local weather forecast offices; the Aviation Weather Center (AWC) in Kansas City, Missouri; and the Alaska Aviation Weather Unit (AAWU) in Anchorage, Alaska.
The AWC issues warnings that cover the conterminous United States and extend over large portions of the North Pacific and North Atlantic airspace below 45,000 feet (13.7 kilometers). The AWC also provides forecasts to international aviation users for airspace above 25,000 feet (7.6 kilometers) around the globe. In Anchorage, the AAWU's forecasts cover Alaska, parts of the North Pacific Ocean, Bering Sea, and Arctic Ocean, extending to the North Pole and a large area of northeast Russia. Weather Forecast Honolulu, Hawaii, issues aviation warnings over a large portion of the central Pacific.
Weather Forecast Office staff members issue more than 4,000 aviation weather forecasts each day. The agency's 122 Weather Forecast Offices provide 575 airports with almost 2,500 aviation weather forecasts and nearly 1,300 in-flight forecasts daily. Together, the AWC and AAWU issue 275 weather products daily. The AWC produces more than 8,000 graphic products daily for thunderstorms, icing, and turbulence. These graphics are used by the aviation industry to supplement primary aviation forecasts.
The National Weather Service also operates 21 Center Weather Service Units (CWSUs) at Federal Aviation Administration (FAA) Air Route Traffic Control Centers across the country. NOAA meteorologists at CWSUs provide in-person guidance to air traffic controllers about threatening weather conditions as they happen.
Today's Forecasting Tools and Products
National Weather Service meteorologists use images from satellites circling the globe, numerical model data from NOAA's National Centers for Environmental Prediction, real-time weather data from Doppler radar and Automated Surface Observation System (ASOS) units at America's airports to generate aviation weather products. ASOS provides minute-by-minute updates on vital weather information, including cloud heights, wind speed, and precipitation. That information is available to forecasters around the clock.
The National Weather Service has developed several other tools to improve forecasting and communication about aviation weather.
The Collaborative Convective Forecast Product
The Collaborative Convective Forecast Product (CCFP) uses collaboration software that allows meteorologists from the AWC, the CWSUs, Canada, and the airlines to discuss thunderstorm forecasts in an Internet chat room, providing outlooks every two hours. The purpose of the CCFP is to help air traffic managers reduce weather-related flight delays and cancellations and improve airline fuel efficiency.
The Aviation Digital Data Service
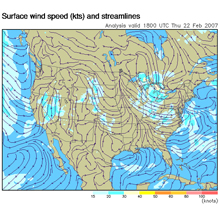
This map, generated by ADDS, shows surface wind speed and streamlines for February 22, 2007. Click image for larger view and full caption.
The Aviation Digital Data Service (ADDS) became NOAA's comprehensive, user-friendly Internet aviation weather resource in September 2003. ADDS, which was developed as part of the Aviation Weather Research Program, was called by Aircraft Owners and Pilots Association Pilot Magazine "perhaps the prime source of preflight weather information for most computer-savvy pilots."
"The Aviation Digital Data Service, combined with modern-day computer technology and the Internet, allows us to provide information at a glance to the people who need it most at the time they need it most," said AWC Director Jack May. "At one Internet location, decision makers have immediate access to information that describes what is happening and what is about to happen."
Graphic Forecast Products
Graphical forecast products are becoming a primary source of information for most users of aviation weather forecasts. The Graphical AIRMET (G-AIRMET), produced by the AWC, will become available in 2007. The Graphical Area Forecast (GFA) will follow shortly thereafter. These products represent significant steps in providing aviation forecast information in formats that are easier to interpret and apply than traditional text products.
Conclusion
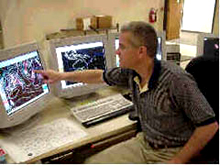
Forecasters from Weather Forecast Offices around the country produce thousands of weather forecasts—many used specifically for aviation—each day.
Advanced computer technology and improved communications and research, combined with the skill and experience of meteorologists, have helped improve the quality and quantity of aviation weather information, which is critical for flight safety and efficiency. The Weather Service will continue to field new and enhanced aviation weather products in cooperation with the FAA.
Current research is expected to lead to more accurate clear air turbulence forecasts at altitudes up to 45,000 feet (13.7 kilometers), better thunderstorm forecasts out to 12 hours, and improved icing severity forecasts. Such future advancements will allow NOAA to continue to deliver information used by airline dispatchers, pilots, and air traffic managers—information that helps them make smarter decisions about where and when to fly to be safe and to reduce fuel use.
