Mussel Watch: Sampling for Coastal Contaminantion
- Monitoring Contaminants Consistently
- Contaminants Monitored
- Sediments, Oysters, and Mussels
- Avoiding the “Hot Spots”
- The Contaminant Baseline
Monitoring Contaminants Consistently for 20 Years
When curious citizens, reporters, elected officials, and scientists wonder about the quality of coastal environments, many turn to NOAA for answers. Different people, of course, view environmental quality in different ways–the size of crowds at the beach; the extent of development; the condition of fish populations, natural habitat, and water quality; even the color of ocean water; or the extent of chemical contamination. Some of these are easy to observe. But a measure like chemical contamination is not. It requires a long-term commitment of sampling, chemical analysis, and interpreting results.

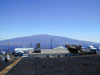
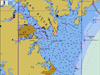
NOAA's Mussel Watch is the longest continuous contaminant monitoring program in U.S. coastal waters. The project has analyzed contaminant trends at 300 sites since 1986. Half the sites are sampled one year; the other half are sampled the next. Click image for larger view.
Since 1986, NOAA’s Mussel Watch has consistently studied and monitored 300 sites around the country for over 100 organic and inorganic pollutants in sediments, oysters, and mussels. Earlier monitoring in the 1960s and 1970s for a subset of these sites extends the contaminant record to over 40 years. Mussel Watch collects samples in all the coastal states, including Alaska, Hawaii, the Great Lakes and Puerto Rico. It is the longest continuous contaminant monitoring program in U.S. coastal waters.
The Mussel Watch data set includes sediment, oyster, and mussel sampling results and is the best source of information to document the impacts of environmental legislation of the 1970s and 1980s on estuarine and coastal environments of the U.S. Its data tell the story of how effective the Clean Air, Clean Water, and Organotin Antifoulant Paint Control acts have been to control contaminants from entering the environment in harmful amounts. NOAA relies on this fundamental data set at a national scale to report the success of declining contaminant levels and to call attention to new contamination problems. It also helps identify local or regional areas requiring additional study to assess environmental health.
Contaminants Monitored
Mussel Watch samples contaminants in the following categories:
- Polycyclic aromatic hydrocarbons (PAHs), compounds formed during incomplete burning of coal, oil and gas, garbage, or other organic substances;
- Polychlorinated biphenyls (PCBs) congeners 1, highly stable compounds used as cooling and insulating fluids for industrial transformers and capacitors, but no longer in general use;
- Several pesticides;
- Butyltins, used in antifouling paint to prevent barnacles from growing on boats;
- Chemical elements such as lead, mercury and zinc;
- Clostridium perfringens, a bacteria found in soils, human and animal intestines, and sewage.

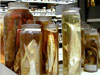
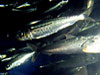
Mussels (shown here) and oysters are sampled every two years and tested for over 100 contaminants. Sediments are sampled once a decade.
Initially, NOAA modeled Mussel Watch sampling on contaminants monitored previously by the U.S. Environmental Protection Agency. NOAA adds contaminants to its monitoring list when it becomes aware of risks posed by new chemical compounds or existing compounds whose risks are beginning to emerge. Such is the case for the flame retardants known as polybrominated diphenyl ethers. Mussel Watch is reanalyzing samples taken since 1996 to determine levels of contamination from these chemicals in the coastal environment. Mussel Watch retains all of it samples for these kinds of contingencies.
Sampling Sediments, Oysters, and Mussels

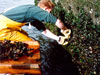
NOAA's Mussel Watch collects samples from shallow subtidal waters and areas between high and low tides like this area in San Diego Bay. Samples are brushed clean and shipped on ice to a laboratory for chemical analysis. Click image for larger view.
Mussel Watch scientists sample sediments, oysters and mussels because of their ability to accumulate contaminants. They take these samples from any of eleven different species of oysters and mussels, also known as bivalves, depending on the area of the country. The species are:
- Zebra mussels (Dreissena polymorpha), Great Lakes
- Quagga mussel (D. bugensis), Great Lakes
- Tropical oyster (Ostrea sandvicensis), Hawaii
- Pacific oyster (Crassostrea gigas), Hawaii
- Eastern oyster (C. virginica), Mid-Atlantic south through Gulf of Mexico
- Foolish mussel (Mytilus trossulus), Pacific Coast
- Mediterranean mussel (M. galoprovincialis), Pacific Coast
- California mussel (M. californianus), Pacific Coast
- Blue mussels (M. edulis), North Atlantic
- Smooth-edged jewelbox (Chama sinuosa), Florida Keys
- Caribbean oyster (Crassostrea rhizophorae), Puerto Rico
Scientists gather oysters and mussels from intertidal to shallow subtidal zones, brush them clean, and ship them on ice to an analytical laboratory within a day. They collect sediments using a grab sampler, and remove the top centimeter (slightly less than one-half inch) for analysis.
Avoiding the “Hot Spots”
Scientists select sampling sites to represent large coastal areas and to avoid "hot spots" or relatively small patches of contamination and away from industrial or sewage outfalls. This enables them to better compare contaminant concentrations across the nation to determine which coastal regions are at greatest risk. Sites selected for monitoring are generally 10 to 100 km (about six to 62 miles) apart.
The Contaminant Baseline

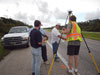
Sediment samples are collected with a grab sampler (shown here) from three stations at each Mussel Watch site. Stations are generally within 100 meters (328 feet) of the site's center. Click image for larger view.
The Mussel Watch data set has allowed NOAA scientists to document the decrease of regulated contaminants such as the pesticide DDT, PCBs, and tributyltin, among others. By analyzing for oil-related compounds, the data set is instrumental in determining background levels of these chemical in the event of a spill. Mussel Watch data helped determine the extent of environmental degradation of the aquatic environment following the September 11, 2001, collapse of the World Trade Center and the effects of hurricanes Katrina and Rita in 2005.
NOAA's Mussel Watch endures as the nation's longest operational coastal contaminant monitoring program, and is called upon by local, state, and federal governments as the standard to which local contamination levels and/or events are compared. It contributes uniquely to further our understanding of the general well-being of the nation’s coastal and Great Lakes environments, and how human use, extreme natural events, and accidental contaminant releases impact these environments.
1. Congeners are variations of a chemical structure. Polychlorinated biphenyls, for example, have 209 congeners.