Regional Fisheries Data Sets
- Underpinnings of Fisheries Management
- CalCOFI
- Biostatistical Menhaden Surveys
- Northeast Bottom Trawl Surveys
- Conclusion
Underpinnings of Fisheries Management
Conducting scientific research or using research results to manage fisheries requires sound data, systematically gathered and organized for comparison with other data similarly gathered and organized, and made available to all. NOAA Fisheries Service regional data sets meet these criteria and are internationally recognized as the underpinnings for excellent fisheries science and fisheries management. Among NOAA Fisheries long-term, regional data sets that are fundamental to its stewardship responsibilities, three stand out:
- California Cooperative Oceanic Fisheries Investigations
- Biostatistical Surveys of Menhaden
- Northeast Bottom Trawl Surveys
Taken together, these three data sets represent over 150 years of netting and sampling fish in all their life stages to help the nation understand the dynamics of it marine fisheries. Each data set is summarized below.
California Cooperative Oceanic Fisheries Investigations (CalCOFI)

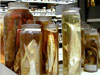
The bongo net (shown here) has been the standard CalCOFI sampler since 1978. Ships retrieve the nets at an oblique angle to collect fish larvae. CalCOFI sampling and equipment specifications must meet and follow rigorous standards.
In 1949, the U.S. Bureau of Commercial Fisheries (an ancestor of NOAA Fisheries Service), the California Department of Fish and Game, and the Scripps Institution of Oceanography created the California Cooperative Oceanic Fisheries Investigations (CalCOFI) in a spirit of partnership and cooperation. The program adopted an ecosystem approach to understanding climate and ocean variability in the California Current and its effects on harvestable resources.
The CalCOFI data set represents the longest (1949-present) and most complete (more than 50,000 sampling stations) time series of oceanographic and larval fish data in the world. It includes abundance data on the larvae of over 250 species of fish; larval length frequency data and egg abundance data on key commercial species; and oceanographic and plankton data. The physical, chemical, and biological data collected at regular time and space intervals quickly became valuable for documenting climatic cycles in the California Current and a range of biological responses to them. CalCOFI research drew world attention to the biological response to the dramatic Pacific-warming event in 1957-58 and introduced the term “El Niño” into the scientific literature.

Once the largest fishery in North America, collapse of the Pacific sardine population in the mid-1960s stimulated the CalCOFI program to conduct regular and intensive fish larvae sampling.
CalCOFI surveys are the basis for NOAA Fisheries research on the population biology of the major coastal open water fisheries–Pacific sardine, northern anchovy, hake, Pacific mackerel, and jack mackerel–of the California Current. These surveys and research have led to improved fishery management and to improved sampling and analytical techniques such as the Daily Egg Production Method, a means for directly measuring total spawning biomass. CalCOFI has shown that long-term data sets are vital to fishery stock assessments, especially in cases where data sets began prior to a fishery. The value of the CalCOFI time-series data set has spanned generations of researchers and prompted a peer review panel to refer to CalCOFI as a “national science treasure.”
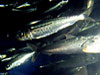
Biostatistical Menhaden Surveys

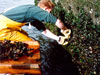
NOAA Fisheries surveys commercial catches like the one annually for its biostatistical menhaden data set. Here workers are pumping the catch from a purse-seine net into a carrier vessel. Menhaden are processed into animal feeds and are also used in the pharmaceutical industry as a source of high-grade omega-3 oils. Click image for larger view.
The biostatistical surveys of the East and Gulf coast menhaden stocks provide information on age and size composition used to assess the stocks and to manage the nation’s second-largest fishery. Unlike the CalCOFI surveys, menhaden sampling is from commercial catches throughout the range of the fishery and centers on sustaining the harvest of a single species.
The NOAA Fisheries lab in Beaufort, North Carolina began preliminary sampling of menhaden catches in 1952; full-scale sampling from Florida to the Gulf of Maine started in 1955. Beginning in 1964 the survey expanded to include the Gulf of Mexico from Florida to Texas. Research products from these appraisals include studies of the biology of menhaden, annual landings forecasts, and stock assessments. Since the surveys began, NOAA Fisheries scientists have processed nearly one million menhaden!
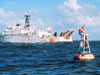
Northeast Bottom Trawl Surveys

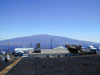
NOAA Fisheries' three oldest and continuous time-series regional data sets, taken together, cover over 150 years of data collection on fish biology, oceanographic conditions, and status of fisheries. Click image for larger view.
NOAA Fisheries Northeast Fisheries Science Center’s spring (1968-present) and fall (1963-present) bottom trawl surveys are the longest running, continuous time-series of bottom fish and marine invertebrate sampling in the world. These Atlantic Ocean surveys stretch from Cape Hatteras to the Canadian border in depths from 30 to 1,200 feet with more than 300 bottom-trawl tows made during each survey. Besides the biological data gathered from the fish and marine invertebrates taken in each tow, the survey collects data on water chemistry, plankton samples and threatened and endangered species such as turtles and whales. Over 900 species of fish and invertebrates have been identified during these surveys, including several that were previously unknown.

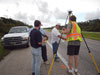
Deckhands and scientists sort a catch from a Northeast bottom trawl survey aboard the R/V Albatross IV. These surveys have documented the collapse and subsequent recovery of several important fish stocks including Atlantic herring and haddock on Georges Bank.
During the survey period of 40-plus years, more than 1,300 individuals from 170 different state, federal, and international agencies and universities have collaborated to conduct the surveys and analyze survey data. This amounts to some 50,000 scientific personnel days! Fishery scientists use the data to assess 45 stocks of commercially and recreationally important fish and invertebrate species in the northeastern United States. Canadian scientists and scientists from the International Council for the Exploration of the Sea and the Northwest Atlantic Fisheries Organization use the information cooperatively in ecosystem research, stock assessment, and investigations requiring long-term standardized data sets.
Conclusion
NOAA Fisheries regional data sets are the backbone of the agency’s scientific research and conservation decisions. Unlike most animals and birds, fish cannot be easily observed and counted by the human eye in the wild. The consistent and standardized sampling of the marine environment and fish stocks allows researchers to compare and generalize their findings about the status of stocks and the health of the marine environment in a manner not possible otherwise. That these three data sets endure year after year testifies to their value, to the dedication of the thousands who have conducted the surveys that continue to provide the data, and to the institutional tenacity and peseverance of NOAA Fisheries.