A History of Charting Our Nation’s Waters
A nautical chart depicts the nature and shape of the coast, water depths, and general topography of the ocean floor; locations of navigational danger; the rise and fall of tides; and locations of human-made aids to navigation. The nautical chart is one of the most fundamental tools available to mariners, who use charts to plan voyages and navigate ships using the shortest, safest, and most economical routes. NOAA and its predecessor agencies have been producing nautical charts for 200 years and NOAA's Office of Coast Survey continually updates its collection of over 1,000 current charts.
- Introduction
- A Need for Charts
- Charting Begins
- An Art Form
- Responding to the Times
- Today's Charts
- Conclusion
While much has changed since Congress authorized President Thomas Jefferson to create this agency, much has also remained the same. We are still a maritime nation dependent upon waterborne trade with foreign countries; we continue to study, explore, and enjoy our coastal waterways; and we still protect our maritime borders. Most importantly, the sea remains a dynamic and unpredictable environment, and despite our best efforts to survey and chart it, navigation retains an element of risk. This article follows the history of nautical charting efforts within NOAA, dating back 200 years.
A Need for Nautical Charts
In early 19th century America, when the new Coast Survey began its work, shipping between the states was along the coast, which was necessary due to difficulties of transporting goods on land. Essential foreign trade, correspondence, and diplomatic forays to Europe were accomplished completely by sea and commercial fishing was a large industry.
Despite the importance of marine navigation, few charts were available to safely guide mariners in their pursuits. The charts that were available were old; shipwrecks were common; and “belligerent searches and seizures” by pirates, as noted in the Congressional record of the day, were a significant problem.
The British had done some coastal charting during the colonial period and during the Revolutionary War. There were also some private charting endeavors, and various Coast Pilot series certainly were useful to mariners of the day. However, what was truly needed was a comprehensive effort to survey our coastal waters and publish the findings. The Coast Survey had its work cut out for it…
The Charting Begins

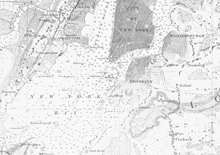
This early chart depicts the waters around New York Harbor. Click image for larger view.
The fledgling predecessor agency to the Office of Coast Survey began its work in earnest with network surveys in New Jersey and New York in 1816. By 1835, hydrographic surveys to measure the depth and bottom configuration of water bodies were being conducted in the entrance to New York Harbor. These surveys not only located dangerous submerged ledges that ships needed to avoid, but also a previously unknown deep channel that would become a main entrance into the harbor, allowing deeper draft vessels to reach the port.
Building from these first coastline surveys, work expanded along the Atlantic seaboard, creating an unbroken chain of control stations from which further surveys could be conducted.
Congress soon recognized the value of the work of the Coast Survey not only to commerce but also to national defense. The scope of the original Congressional act that created the agency was thus broadened. Greater resources were also made available and more responsibilities were assigned to the Coast Survey, including surveying further out from the coast. Along with hydrographic charting, the Coast Survey also began conducting scientific studies. These included magnetic surveys and the first major study of the Gulf Stream.
Development of an Art Form
Following the acquisition of the remainder of the Western Bristish territories in 1846, and the addition of Texas and California after the war with Mexico in 1848, the Coast Survey was responsible for mapping nearly 54,000 miles of coastline.

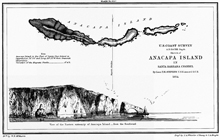
This nautical chart from 1854 shows an artistic rendering of the headlands of Anacapa Island, off the coast of California. Click image for larger view.
With great attention paid to the collection of accurate data, and advances in engraving and printing techniques, these early nautical charts were of the highest caliber. They showed not only the depths of the unseen sea floor, but often portrayed skilled artists’ renderings of important headlands and capes, as seen from a mariner’s perspective. Topographic form and land usage were also captured with the finely engraved lines. Examining these charts today offers a detailed glimpse into the early days of coastal communities.
The written reports and narratives by surveying officers also offer a wealth of information for today’s historians and anthropologists. The reports included descriptions of local trade and commerce, fishing practices, port facilities, and shipwrecks. These surveyors were explorers in every sense of the word.
Responding to the Times
As the major events of the country’s history unfolded, the need for accurate nautical charting became paramount. The discovery of gold in 1849 increased ship traffic dramatically to and from California, and the purchase of Alaska in 1867 added another 34,000 miles to the nation’s shoreline. During the Civil War, the Coast Survey worked actively to meet the Union’s high demand for topographic maps and charts. After the war, the Coast Survey continued its coastal work, conducting more surveys and adding more chart coverage to its catalog.
Current events continued to direct the Coast Survey’s activities, and by the end of the 19th century and start of the 20th century, the need for charts was at an all-time high. Once again, the discovery of gold, this time in the Klondike region of Alaska, lured many fortune-seeking travelers there by sea. New territorial possessions acquired at the end of the Spanish-American War in the Philippines and Hawaii, and the administration of the Panama Canal Zone, added even more coastal waters to the Survey’s list of responsibilities.
During World War II, Coast Survey hydrographers, cartographers, and engravers actively supported the war effort. For example, the USS Pathfinder, a Coast Survey ship used by the U.S. Navy for the duration of the war, was pivotal in providing surveys and charts in the Philippines, operating in advance of fleet units.
Ultimately, the Coast Survey adopted responsibility for charting over 3.4 million square nautical miles of water and 95,000 miles of shoreline, alerting mariners to the depths and dangers along the 200-mile zone adjacent to the U.S. coastline, an area known as the Exclusive Economic Zone.
Today’s Charts: Snapshots of Time

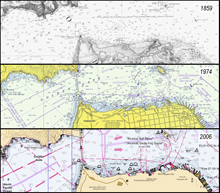
These three charts depict the same area near San Francisco at three different times—1859, 1974, and 2006. Note how the charts have changed over the years. Click image for larger view.
The nautical charts of today maintain many of the same characteristics and coverage as the Coast Survey’s earlier editions. A stroll through NOAA Coast Survey’s Historic Maps and Charts Web site offers a timeline of discovery. Shoreline changes, coastal development, detection of new rocks and wrecks, aids to navigation modernizing over time...these nautical charts are a record of this country’s growth, snapshots showing our evolution over time. The charts also reveal our continued dependence on marine transportation and maritime commerce 200 years later, with the growth of ports and deepening of navigation channels.
As our strongest link to the global market, our waterways now carry over 95 percent of U.S. foreign trade tonnage each year, contributing over 13 million jobs and $742 billion to the U.S. economy. Commercial shipping, commercial fishing, recreational boating, tourism, national defense, emergency response, and coastal management are among the many uses dependent upon NOAA’s nautical charts.

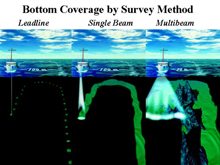
Hydrographic surveying techniques and procedures have changed over time with evolving technology. Multibeam sonar technology makes it possible to collect 100 percent bottom coverage of an area and creates large volumes of data. Click image for larger view and full caption.
Nautical charts are also snapshots of advancements made in surveying and mapping technology. New data displayed on today’s charts are collected by multibeam and side scan sonar, which provide a comprehensive sweep of the sea bottom that detects obstructions. Older charts, on the other hand, were populated with data collected from lead-line soundings or readings from casts of a weighted rope.
A nautical chart today might carry data from multiple eras, modern and old. The 21st century chart also comes in electronic formats, to meet the needs of mariners operating with the latest technology on their ship bridges. These electronic navigational charts enable the mariner to customize what is shown on the screen, and they deliver far more information about chart features than has ever been possible before.
Conclusion: An Important Legacy
The Coast Survey of today delivers its nautical charts motivated by the same three factors that motivated chart development 200 years ago: safety, security, and efficiency. NOAA recognizes that U.S. waterways are highways for commerce, intrinsic to maritime awareness, valuable resources for recreation, and places of environmental beauty. Incidents like the 1989 Exxon Valdez disaster in Alaska, the 2004 Athos I strike of a submerged object in a navigation channel in Delaware, and the disarray left behind in Gulf waterways by the 2005 hurricanes demonstrate the critical vulnerabilities in our marine transportation system. These economic and environmental tragedies are stark reminders of the hazards facing mariners navigating in U.S. waters, serving as evidence of the continued need for accurate and updated nautical charts.
Because everyone depends on safe marine transportation for something, be it the food we buy, the clothes we wear, the gas that fuels our cars, or the oil that heats our homes, NOAA’s information about the uncertain environment in which mariners must operate becomes ever more critical.
The fact that NOAA’s surveyors, hydrographers, and cartographers continue their pursuit of excellence in charting the nation’s shoreline and waters for safe and efficient marine transportation is a credit to the foresight of our founding fathers, and a reminder of how vital maritime commerce is to the United States, even 200 years later.
Contributed by Joseph Robinson and Ashley Chappell, NOAA's National Ocean Service
