Transformations in Coastal Mapping: 1987 - 2007
One of the missions of NOAA's National Geodetic Survey is to survey coastal regions and provide the nation with accurate, consistent, up-to-date national shoreline. The national shoreline provides the critical baseline data for demarcating America's marine territorial limits, including its Exclusive Economic Zone, and for the geographic reference needed to manage coastal resources, make nautical charts, and many other uses.
- Introduction
- Controlling the Imagery
- Photography and the Coast
- Mapping and Delivering the Shoreline
- Conclusion
Since the late 1920s, collecting and using high-resolution aerial photography to define the nation’s 95,000-mile shoreline has been a responsibility of NOAA’s National Geodetic Survey (NGS) and its predecessor, the Coast and Geodetic Survey.
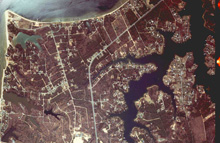
This aerial photo was taken in March 1986, as part of a coastal mapping project in the vicinity of Drum Point in the Chesapeake Bay. Click image for larger view.
The primary aerial photographic product is a 9x9-inch color photograph. Other types of photographs include black and white (or panchromatic), false-color infrared, and black-and-white infrared. Aerial photographic surveys are conducted on varying time cycles, depending on the amount of change caused by human or natural forces.
Photography is acquired when weather conditions, sun angle, and water levels are optimal to ensure that photographs will be suitable for a variety of purposes using standard photogrammetric techniques.
Aerial photographs are the primary source for creating coastal survey maps and digital map feature files. These maps and files, in turn, provide data for producing NOAA nautical charts. Data showing the accurate location of the shoreline is also used as a source to define the boundaries between private, state, and federal ownership and jurisdictions, including the territorial sea and the U.S. Exclusive Economic Zone.
These photographs have many other uses as well, including coastal management, waterfront development, natural resource identification, water depth measurements, topographic mapping, seabed characteristic mapping, and location of features or obstructions to ensure the safety of marine and air navigation.
The article looks at some of the technological advances and operational changes that have transformed the way that NOAA maps the shoreline of the United States.
Controlling the Imagery
Aerial imagery provides an excellent view of the landscape, but to be used for the most accurate mapping, the imagery must be tied in to the reference system of the map. In the past, this was achieved using ground control points. With the advent of the global positioning system (GPS) and new positioning techniques, imagery can be controlled directly, without any need for costly ground control surveys.
The Way It Was…
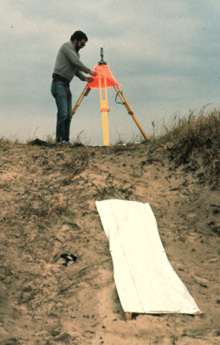
The coordinates of the photo control panels were determined by NGS surveyors on the ground, using traditional surveying equipment and techniques. Click image for larger view.
Twenty years ago, GPS was in its infancy. After the failed launch of three out of 10 satellites, the system included only seven functioning satellites. Future launches were delayed until 1989 due to the grounding of all space shuttles after the Challenger disaster.
The methods for using GPS to accurately position a fast-moving platform, such as an airplane, were still being developed. At that time, all aerial photography for mapping had to be controlled using ground control points. These were locations on the ground in the project area that were visible in the photographs and had known positions or coordinates (latitude, longitude, and height) on the Earth. The ground control points were usually marked with large white cloth panels of various designs to make them easy to identify and measure in the photographs.
Photo control panels could be set up to mark an existing geodetic control point, or the panels could be laid out in any convenient location suitable for controlling the aerial photos and their coordinates determined by a new geodetic survey.
The Way It Is…
Today, GPS has grown into a system of 30 satellites orbiting the Earth and transmitting signals that can be used by a receiver on the ground (or in an airplane) to triangulate its position. The coordinates determined from GPS are very accurate (down to a few meters), but the standard positioning techniques are not accurate enough for controlling aerial mapping photography.
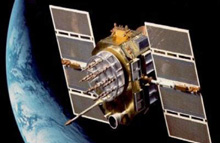
GPS satellites orbit about 20,000 kilometers above the Earth’s surface. Each satellite carries an extremely accurate atomic clock and transmits continuous, precisely timed signals, which can be picked up by receivers on the surface. A receiver needs signals from at least four satellites to determine its latitude, longitude, and height.
In the late 1980s, while working for NGS, Dr. Benjamin Remondi led the development of a groundbreaking technique for processing the signals from GPS satellites called “On-the-Fly Kinematic surveying.” Using this technique, the position of the camera when an aerial photo is taken can be determined to an accuracy of only a few centimeters — even from an airplane traveling over 100 meters every second! Today, all aerial imagery for coastal mapping is positioned using airborne kinematic GPS techniques
Much of the coastal mapping imagery that NOAA collects today also includes precise inertial data. These are measurements made by very advanced gyroscopes and accelerometers attached to the aerial camera. The inertial data is processed in combination with the GPS data to determine the precise orientation (tilt and heading) of the camera, as well as its position.
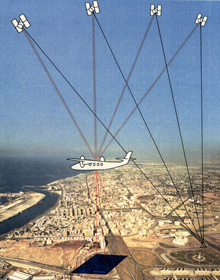
Differential GPS positioning uses two receivers picking up signals from the same set of satellites. Click image for larger view and full caption.
Even though airborne GPS is accurate enough to position the imagery by itself, a few ground control points are usually still used to help improve the final accuracy and to provide an independent check of the GPS positioning.
Photographing the Coast
Since the 1930s, aerial photography has been the primary source for delineating the shoreline within NOAA’s Coastal Mapping Program. NOAA’s archive of over 500,000 aerial photographs provides a unique long-term record of coastal areas throughout the nation.
The Way It Was…
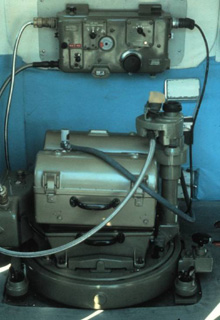
This aerial mapping camera was used by NGS in the 1960s and 1970s for coastal mapping. Later it was transferred to the Aeronautical Charting Office for their Flight Edit program.
In the late 1980s, film cameras were the only source of imagery. NGS owned and used three mapping cameras. These old cameras were not compatible with the emerging GPS technology. Also, film from these cameras took about a month to be developed, printed, and indexed before it could be used for mapping.
The digital sensors available at the time were generally used for land and resource studies, not for high-precision mapping. They simply did not have the high resolution needed to support large-scale mapping.
The Way It Is…
Today, aerial imagery used for mapping the coast comes from many different sources. In addition to the standard 9x9-inch film photography that NGS has been using for decades, we now use imagery from airborne digital cameras and from space-based high resolution sensors on commercial satellites. Even though the standard photography is originally collected on film, it is almost always converted to digital format (i.e., scanned) before being used for mapping.
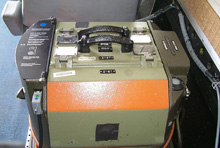
A modern aerial mapping film camera, purchased in 1990, and still used by NGS today.
In 1990, NGS purchased a new film camera. This new camera included the ability to send a signal pulse to the aircraft’s GPS receiver each time a picture was taken, enabling precise positioning of each photo. In 1992, the new camera was modified to allow for customizable film labeling and improved image motion compensation. Now, in 2007, this camera is the only film camera still being used by NGS for coastal mapping.
In 2002, NGS borrowed, and eventually purchased, a digital camera. The Applanix Digital Sensor System (DSS) does not use film at all, but records images digitally using a light sensitive chip. The camera also includes built-in positioning and orientation sensors. All of the image and navigation data from the DSS are recorded on a removable hard drive, which can be sent to the office for processing or be processed on a portable computer right in the field.
The DSS has primarily been used for collecting emergency response imagery, due to the need for rapid turnaround after a disaster. For example, after Hurricanes Katrina and Rita in 2005, NGS made the post-storm imagery available on the Internet within 24 hours of its acquisition.
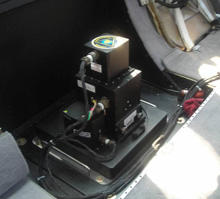
NGS’s new digital camera, shown mounted in the floor of a NOAA airplane, was recently upgraded with a new lens, sensor chip, and a mount that automatically adjusts the azimuth (heading) of the camera during the flight.
The past decade has seen the introduction of commercial satellites capable of providing very high resolution images of the Earth. In 2000, NGS began using this new source of imagery to evaluate port areas for shoreline changes. If the evaluation indicated significant changes between the charted shoreline and the new imagery, then a regular coastal mapping project would be planned to update the charts in that area.
Recently, NGS has been updating certain types of charted features directly from the satellite imagery.
Mapping and Delivering the Shoreline
The natural and human-made environments along the U.S. coastline are continually changing. One of the primary missions of NGS is to map the shoreline and associated natural and cultural features, in order to keep NOAA nautical charts up-to-date. NGS makes all of its shoreline mapping data freely available to the public over the Internet.
The Way It Was…
By 1987, NGS had moved away from the old analog mapping systems, which used purely mechanical stereoscopic plotters. These plotters were replaced with several specially designed analytical plotters. These were optical-mechanical instruments that worked with computers to measure and calculate all the parameters needed to position and orient photographs.
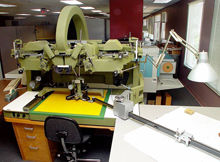
A mechanical (analog) stereoscopic plotter is a precision instrument designed to accurately simulate the projection of a stereomodel formed by two overlapping photographs. Click image for larger view.
Analytical techniques were used to correct for, or minimize, all known errors and distortions in the photographs. The cartographer would use the instrument to trace the features in the photographs, and the system would record the coordinates and information about the mapped features.
At the time, all software and file transfer formats were developed for internal use. Mapping data were delivered to the Nautical Charting Division on floppy disk and used in their new computerized system to revise nautical charts. Shoreline data were only used within NOAA and were generally not made available to the public or outside agencies except by special arrangement.
The Way It Is…
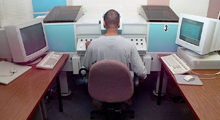
An analytical plotter does not form an optical or mechanical stereomodel of overlapping photographs; rather, it mathematically computes, in real time, the model coordinates of photographs and transmits this data to a computer-driven plotting device or records it in a digital database.
In 1995, NGS began investigating the use of softcopy photogrammetric systems for coastal mapping. These systems are called “softcopy” because they operate only with digital images (i.e., scans of photographs or images from digital sensors), rather than with “hardcopy” film or glass photographic transparencies. Today, NGS uses softcopy photogrammetry for all of its coastal mapping projects.
Softcopy photogrammetric workstations use the same computational methods as the analytical plotter systems and have the same highly accurate mapping capability. However, the softcopy systems do not suffer from the physical limitations and high maintenance costs of optical-mechanical instruments. Furthermore, the vendors of softcopy systems continually improve their software to allow for a very high degree of automation in the mapping process, greatly improving production rates.
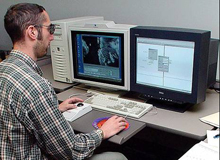
A softcopy workstation typically consists of a high-end desktop computer running specialized photogrammetric software with plenty of disk space for data storage, a three-dimensional pointing device (usually a trackball or special mouse), and a stereo display system for viewing the digital images in three dimensions.
Today, all of the shoreline data produced by NGS are distributed to both internal users and to the public through the NOAA Shoreline Data Explorer (NSDE) Web site. The NSDE allows users to view and download all of the data in the NGS Shoreline Database.
On the Web site, the user can search for coastal mapping projects by using an interactive map or by entering a project name, description of an area (e.g., “New Orleans”), or the state where an area is located. The shoreline features are displayed, using various colors and symbols, as separate data layers, which can be turned on and off individually.
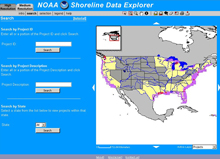
The NOAA Shoreline Data Explorer can be accessed through the NGS Web site and allows users to view and download new and historic shoreline data. Click image for larger view.
The shoreline can be downloaded as shapefiles (a common format for Geographic Information Systems), including either a whole project, or just the area and layers that the user has displayed on the screen. Standard metadata, which describes important information about the project, is included for viewing or downloading as well.
Conclusion
Over the past 20 years, technological advances and operational changes have transformed the way NOAA maps the shoreline of the United States. In the past, all of the shoreline maps were produced by NOAA personnel, using analog and analytical mapping techniques, primarily for internal use. NOAA now manages the majority of its mapping projects through contracts with private mapping firms, uses advanced digital mapping technology, and distributes the data to a broad community of users.
From the collection of the imagery used to map the coast, to the delivery of the final products, and all the work in between, NOAA is fully embracing the digital age.
Contributed by Tim Blackford, NOAA’s National Ocean Service
