Chasing Bad Weather, Tracking Bad Air: The Answer Is Blowing in the Wind
Since its establishment, NOAA has closely observed, studied, and modeled natural phenomena, leading to better understanding and prediction of natural processes and disturbances in the oceans and atmosphere. This work has helped to save property and lives by allowing the development of better severe weather forecasts.
- Introduction
- Outfitting Storm Chasers
- Helping the Hurricane Hunters
- Better Forecasts
- The Air We Breathe
- Conclusion
- Works Consulted
Hurricane hunters, tornado chasers, cloud watchers, trace-gas tracers, model makers, remote-sensor designers, lab laborers—NOAA researchers are called many things!
These names reflect their creativity, adventurous spirit, and unquenchable curiosity about the physical world and how it works. Over the past 20 years, these traits have enabled NOAA researchers to contribute to better forecasts and warnings of destructive weather, help local communities deal more effectively with air quality issues, and enhance NOAA’s ability to predict the Earth system.
This article chronicles the evolution of NOAA’s work, ideas, and technology used to study our atmosphere over the past 20-30 years.
Outfitting Storm Chasers
Deadly and destructive tornadoes, and the storms from which they spring, have been the focus of the NOAA National Severe Storms Laboratory (NSSL) since its founding in 1964. Through ingenuity and creativity spanning more than 40 years, NOAA scientists and engineers have taken technology to the edge in studying severe storms.
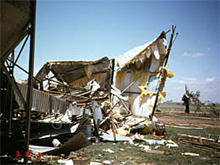
Some of the damage caused by a tornado in Texas.
The Way It Was…
Radar is the primary tool used by forecasters to detect, track, and warn for tornadoes and other severe weather such as strong winds and hail. On May 24, 1973, a tornado touched down near Union City, Okalahoma. On that day, NOAA researchers captured a tornado on Doppler radar for the first time. They saw a tornado “signature” – winds coming toward and going away from the radar right next to each other, signifying the storm’s rotation.
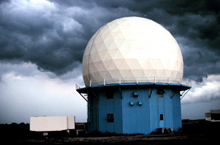
Doppler radars known as Weather Surveillance Radars developed by NOAA Research were installed across the country as part of National Weather Service modernization efforts. Click image for larger view.
By the early 1990s, it was clear that Doppler radar could improve the nation’s ability to warn of severe thunderstorms and tornadoes. This led to the installation of a national network of NEXRAD Doppler radars. Since its introduction, NEXRAD has decreased the number of tornado-related deaths by 45 percent and personal injuries by 40 percent.
Also in the 1990s, NOAA scientists began studying storm behavior by using mobile facilities to place instruments directly in a storm. Vehicle-borne weather sensors and mobile balloons allowed scientists to make measurements of storms while tracking them. In the mid-1990s, scientists participated in an experiment called VORTEX that studied the birth and development of tornados. VORTEX obtained high-quality data on several super-cell thunderstorms, which greatly furthered NOAA’s understanding of tornados and laid the foundation for future studies.
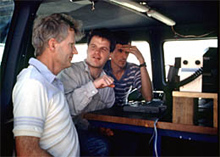
These storm chasers are making last minute checks of their mobile equipment during the VORTEX experiment in the early 1990s. The equipment is part of an automated observing system that collects and transmits data continually to a central point where they can be distributed and archived. From left to right: R. Davies-Jones, J. Straka, and E. Rasmussen.
The Way It Is…The Radar of Today
NOAA continues to pioneer the development of weather radar. NSSL is presently researching the use of dual polarization radar to improve precipitation measurements and hail identification. This upgrade to NEXRAD Doppler radar provides information about precipitation in clouds to better distinguish between rain, ice, hail, and mixtures. This will help forecasters provide better warnings for flash floods, the number-one severe weather threat to human life.
NSSL is incorporating cutting-edge science of severe weather signatures into tools designed to help National Weather Service forecasters make better and faster warning decisions. The latest tool, the Warning Decision Support System II, includes detection tools for the NEXRAD Doppler radar and other sensors to identify rotation in storms preceding tornadoes, the likelihood and size of hail, as well as identifying and tracking storms. Several of these tools have been integrated into the National Weather Service's systems and have contributed to better warning times with fewer false alarms.
NSSL scientists also recently completed several field experiments. The Intermountain Precipitation Experiment, for example, was designed to improve winter weather forecasts, especially in high population growth areas of the western U.S. The Severe Thunderstorm Electrification and Precipitation Study focused a number of data-gathering tools on thunderstorms in the high plains, to better understand how rain and lightning are formed.
The knowledge gained through these field programs will lead to better forecasts of deadly weather phenomena including tornadoes, lightning, hail, flash floods, heavy snow, ice, and freezing rain.
Helping the Hurricane Hunters
The Way It Was…
In the 1970s, NOAA began using P3 Orion aircraft as “hurricane hunters,” to gather data from inside hurricanes. In the 1980s, new instrumentation on the P3s provided scientists with information about the winds in the inner core of the storm, providing insight into hurricane structure and dynamics. Researchers began dropping instruments called “dropwindsondes” into storms, which provided, via radio, the temperature, humidity, and pressure of the air over the ocean—data heretofore unavailable to modelers. These data improved the accuracy of hurricane track forecast models by 20 to 30 percent.
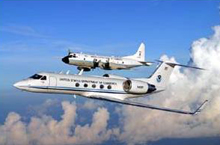
NOAA’s hurricane-hunter aircraft, the P-3 Orion (in the background), was used in the 1970s and 1980s. The Gulfstream-IV jet (foreground), introduced in the 1990s, revolutionized hurricane research.
In the late 1980s through the late 1990s, NOAA researchers made large strides in understanding hurricanes. They improved models that forecast the persistence of hurricane intensity and developed a new prediction scheme that improved intensity forecasts. In 1992, studies conducted during Hurricane Andrew generated data on its wind field, damage patterns, and explosive intensification during landfall. Rapid intensification is a problem that researchers continue to explore.
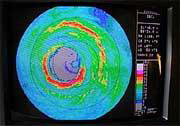
This image shows the eye of Hurricane Isabel as viewed from one of the Doppler radar instruments on board a NOAA P-3 aircraft.
In 1997, NOAA received its first high-altitude jet, the Gulfstream IV, for hurricane and synoptic weather investigations. New dropwindsondes employed global positioning system technology to obtain more accurate positions, and hence, more accurate wind data. For the first time, soundings were made inside the hurricane eye wall, offering insights about the hurricane boundary-layer wind structure.
The Way It Is…
Today, research at NOAA’s Atlantic Oceanographic and Meteorological Laboratory (AOML) in Miami, Florida, continues in conjunction with the modeling expertise at the Geophysical Fluid Dynamics Laboratory in New Jersey. This research is focused on the goal of improving our ability to forecast hurricane landfall and intensity.
The Hurricane Research Division of AOML recently began a multi-year experiment called the Intensity Forecasting Experiment (IFEX). The experiment is focused on improving hurricane intensity forecasts by collecting observations that will aid in the improvement of current operational models and the development of the next-generation operational hurricane model. Observations will be collected in a variety of hurricanes at different stages in their lifecycle – from formation and early organization to peak intensity and subsequent landfall or decay over open water.
Among exciting aspects of IFEX are:
- Hurricane genesis experiment: Flown with a single NOAA P-3 aircraft into tropical disturbances where few aircraft measurements have been made over the past 25 years because it is so difficult to collect data in these systems. These observations will help us improve our understanding of how precursor storms become hurricanes.
- Aerosonde project: While use of the WP-3D Orion and Gulfstream IV aircraft have made NOAA a global leader in hurricane surveillance and reconnaissance, it is very dangerous to fly manned flights near the surface of a hurricane. To get rarely observed measurements of the near surface, NOAA researchers will be using low-flying unmanned “aerosondes” to gather this data. Besides contributing to better understanding of the total hurricane environment, another benefit of this work will be real-time transmission of hurricane surface conditions directly to NOAA’s hurricane forecasters.
- Impact of Saharan air on intensity forecast models: Because the presence of dry air can impact strength and longevity of hurricanes, researchers are taking a closer look at very dry air originating from the African continent. The Saharan air feature may play an important role in the ability of operational models to predict hurricane intensity. More accurate measurements of humidity, provided by instrument packages dropped into hurricanes, could contribute to hurricane models that produce better tropical cyclone intensity forecasts.
Better Forecasts
While researchers in Oklahoma and Florida chase tornadoes and fly into hurricanes and designers improve models, NOAA scientists in Colorado study ways to improve short-term weather forecasts by improving technology.
The Way It Was…
The Colorado team’s mission is to improve forecasting by developing and testing systems that can handle and display more data.
In the early 1980s, they devised a way to combine real-time radar reflectivity data from Weather Service radars, visible and infrared images from satellites, and temperature and pressure measurements from surface stations into one data stream. This gave forecasters a single place to access the data to make a forecast. Before this new technology, a forecaster had to incorporate and compare data streams mechanically in order to interpret the combined influence on the forecast.
Throughout the 1980s, the Colorado team (later called the Forecast Application Branch of NOAA's Global System's Division) continued to develop an advanced forecasting workstation to handle ever-larger streams of data, as well as numeric models. Eventually, the interactive processing computer workstations were installed in more than 100 weather forecast offices across the United States.
The Way It Is…
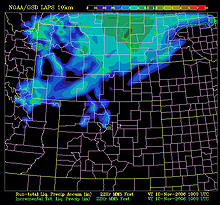
NOAA researchers have developed the Local Analysis and Prediction System, or “LAPS,” which integrates data from virtually every meteorological observation system into a very high-resolution gridded framework. This image shows precipitation for the Rocky Mountain region. Click image for larger view.
Today, the Forecast Application Branch is a leader in advancements of “massively parallel processing,” an affordable and practical way to run the ever more complex numerical models used in weather forecasting. Improvements in weather prediction are tied to both higher model resolution and the integration of new data that offer finer resolution in space and time.
When researchers needed more computer power to solve problems in fluid dynamics, physics, and data assimilation, this team found the answer. They procured larger numbers of commodity microprocessors and wrote software to allow the processors to communicate with each other while each worked on a segment of the problem. Today, models run on the parallel processing system are providing more accuracy and finer detail for forecasters.
The Air We Breathe
Air quality is a serious national concern. High concentrations of fine particles in the air and ground-level ozone cause respiratory and cardiovascular problems, contributing to tens of thousands of premature deaths annually.
Air quality research goes hand in hand with studies of weather at NOAA, because air quality is influenced by conditions in the atmosphere. From the beginning, NOAA researchers have worked with those responsible for making national policy, as well as with the states and communities who must comply with air quality regulations.
The Way It Was…
Air quality research began with the nuclear age and grew up as the nation learned about “smog” and other types of air pollution and addressed these with the Clean Air Act of 1963 and subsequent amendments passed by Congress.
In the 1980s and 1990s, air quality research focused on regional studies of the causes of air pollution. Researchers discovered that every situation is different and depends on natural processes as well as human sources of pollution. For policymakers, this means that “one-size-fits-all” solutions will not work and that intensive regional studies can help them determine the causes, and possible solutions, to regional air quality issues.
One issue that was particularly prominent during this period was the ways ozone affects human life. Most ozone is found in a layer more than six miles above the Earth. This stratospheric ozone layer prevents the sun's harmful, high-energy radiation from reaching Earth's surface. In contrast, ozone at the Earth’s surface is a pollutant that harms human health and crops.
Researchers discovered that the photo (light)-chemical process that produces ozone greatly impacts efforts to reduce it. One precursor to ozone, volatile organic compounds, can come from automobile exhaust, from smokestacks – or from trees! NOAA researchers found that a power plant in a rural forested area was responsible for forming more ozone pollution than a power plant located in a non-forested area.
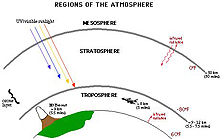
Regions of the atmosphere. The ozone layer is a thin, invisible layer of the Earth's atmosphere normally about 15 miles thick. Click image for larger view.
During the past 20 years, researchers identified gases and particles that occur naturally or are the result of human activity. By considering the chemistry and physics of these factors, gathering as much data as possible, and then analyzing it to identify the causes and possible cures for air pollution, scientists were able to build models to help forecast what will happen next.
Air quality studies in the past decade also focused on how pollutants – from ozone to smoke from forest fires – can be transported to compromise the air in other regions. This research goes hand-in-hand with studies of the chemistry and dynamics that govern the formation and mixing of pollutants in the daytime and nighttime air.
The Way It Is…
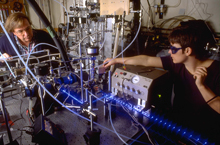
In addition to intensive regional field studies, NOAA scientists conduct laboratory experiments to study chemical reactions that are important in air quality. Their quest for better understanding of processes that influence air quality is leading to development of models to forecast air-quality conditions. Click image for larger view.
NOAA is developing computer models of air quality that simulate the formation and transport of pollutants. These models are based on the scientific understanding of key physical and chemical processes developed in lab and field experiments. Policymakers and managers at all levels of government use these models to understand how potential policies and regulations will affect air quality.
NOAA’s National Weather Service also uses air quality models to predict ground-level ozone concentrations. Those predictions are used by state and local air quality forecasters and by the public to reduce health effects during episodes of poor air quality.
Conclusion
Over the past 30 years, NOAA researchers have advanced our knowledge of Earth system science to unprecedented levels. Developing new observation tools and using insights gained from the field and lab, researchers are helping operational forecasters deliver more accurate and timely warnings of severe weather, saving lives and property. Researchers have brought the best and latest scientific information to those who make rules or decisions about air quality and to the public.
Research over the next 30 years promises to develop, through ever better observations and understanding, an Earth system model that can tell us what will happen next, on the scale of minutes (tornadoes), to days (hurricanes), to months (drought), to decades (climate change), and beyond.
Contributed by Carol Knight, NOAA’s Office of Oceanic and Atmospheric Research and Keli Tarp, NOAA Office of Public Affairs
Works Consulted
Simmons, K.M. & Sutter, Daniel. (2005). WSR-88D Radar, Tornado Warnings, and Tornado Casualties [Electronic Version]. Weather and Forecasting, 20(3), 301-310.
(top)
