Changing Technology for Tide Measurements: The Way it Was
Measurements of tides and water levels play a major role in the lives of those living, working, or sailing around our nation's coasts. For 200 years, NOAA has measured, processed, and made tide information available to those who need it, from weather forecasters, to coastal managers, vessel captains, and recreational boaters.
- Introduction
- The Beginning
- Transition to Recording Tide Gauges
- Transition to the Digital World
- Role of the Tide Observer
- Conclusion
Tides are the periodic rise and fall of sea level under the gravitational pull of the moon. Monitoring tides has always been important to people who look to the sea for their livelihood.
The historical record from NOAA tide and water level stations transcends the maritime history of the United States, from the days when clipper ships relied upon tide predictions to navigate ports and harbors, to modern-day mariners that obtain real-time water levels to ensure that water in channels and under bridges is of sufficient depth to allow huge ships and crane barges to pass through. Commercial and naval wharves, seawalls, bridges, underwater communication cables, pipelines, and other engineering works have all been designed and built taking the tides into consideration. Fishing trips are planned to coincide with stages of the tide, as are recreational beachcombing and tide-pooling. Surfers plan trips to favorite breaks based on tide predictions, and habitat restoration managers are now relying upon accurate tide information to tell them when and how high up the shore to plant marsh grasses.
The story that follows relays changes in tide observation technology within NOAA. These changes closely mirror changes in technology in the United States.
In the Beginning: The First Systematic Tide Observations
From the beginning of the work of the U.S. Coast Survey in 1807, tide measurements were required to understand the most fundamental characteristics of the time and range of tides in major ports and harbors. Regular, or systematic, observations were required to produce tide prediction tables, to compute reference points based on tides (tidal datum references), and to provide tide correctors for soundings taken during hydrographic surveys.

A typical graduated tide staff used to record the tide. Click image for larger view.
Until the mid-1800s, the primary method for observing the tide was to place a vertical staff in the water. This staff was divided, or graduated, by some unit of linear measure such as inches. An observer would read the elevation of the tide on the staff every hour (or some increment of an hour). These values were recorded for subsequent tabulation and analyses.
Although not challenging in confined harbors with easy access to piers and other structures, on open coasts and in remote locations, using tide staffs to observe tides was often very difficult. This is because staffs had to be installed along rugged coastal areas with high waves and strong currents and tide observers often had to take readings in harsh weather conditions.
For tide staffs installed in harbors, a slight variation over “fixed-staff” observations was the introduction of a floating staff. The staff was encased in a stilling well that would move vertically with the tides. The observer would read the water level on the staff relative to a reference point that was surveyed (leveled) to local reference marks on the land (known as benchmarks). This tide staff configuration was often enclosed in a small tide house, not unlike those in use in many locations today. The advantage of this arrangement was that the observer was not exposed to the elements and that it was possible to make much more accurate observations than was possible from a remotely viewed, fixed staff. When using a fixed staff, it was more difficult to get good sets of continuous staff readings if high waves were passing by the staff and the observer had to withstand high winds and rain.
The Transition to Recording Tide Gauges
One of the disadvantages of tide staffs was that measurements could only be taken if an observer was present. This meant making tidal observations was time consuming. Improvements in technology led to tide gauges that worked with increasingly less human intervention.
The Saxton Gauge
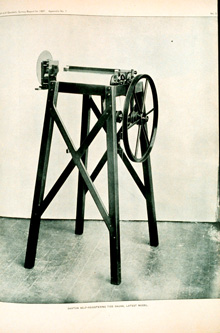
Joseph Saxton invented a self-registering tide gauge in 1851. This tide gauge ran continuously with minimal human care. While this gauge was not the first self-recording tide gauge, it was an improvement over existing instruments and was the type first deployed by the U.S Coast Survey.

A self-registering "Saxton" tide gauge.
This gauge used a float that rose up and down with the tide inside of a stilling well. The float was attached to a wire that connected to the mechanical pulleys and gears that drove a stylus across a strip chart. The movement of the stylus essentially created a graph of the tide over time. Spring-wound clocks were used to advance the strip-chart at an even rate so that the values could be read and correlated with time.
The Saxton gauge was first installed in San Francisco, California on June 30, 1854, and was the first of a succession of new technology tide gauges that have produced the continuous recording of water levels for more than 150 years. The tide station is now part of a NOAA network of 200 long-term tidal and Great Lakes water level stations that have been established throughout the continental United States, Alaska, Hawaii, Pacific Island territories, Puerto Rico, and the Virgin Islands.
The Standard Tide Gauge
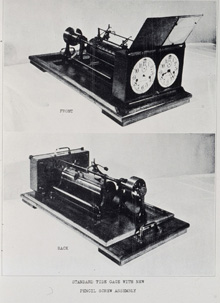
The Saxton gauge was eventually replaced by a more compact analog tide gauge known as the Standard Tide Gauge.

The Standard Tide Gauge was used until the late 1960s, when Analog-to-Digital Recorders were introduced. Click image for larger view.
The sensors of Standard Tide Gauges were floats attached by wire to a gearing mechanism in a stilling well. The gearing mechanism drove the location of a pencil relative to a rotating drum covered with a paper tide record sheet. The stilling well configuration calmed the waters around the float, to allow an accurate reading in the presence of waves. A typical stilling well consisted of a 12-inch wide pipe. Inside the stilling well, an eight-inch diameter float was hung by wire from the recording unit above.
These systems of floats, cables, pulleys, and mechanical clocks produced paper strip charts for manual processing. The whole system was time synchronized such that the pencil tracings of the risings and fallings of the tide could later be scaled to determine the heights and times of various stages of the tides. The recorders used sophisticated state-of-the-art spring-wound clocks for timing control. This new system caused a revolution in both the quantity and quality of tide records acquired by the Coast Survey.

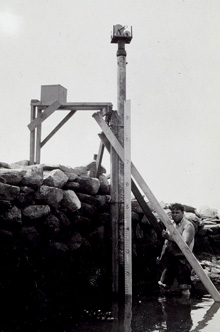
Portable tide gauge installation with analog wax-marigram gauge and tide staff. Click image for larger view.
The tide records were processed by hand. Strip charts were placed on rollers to advance the strip chart across a desk and scales (calibrated rulers) were used to read off the time and heights of the high and low tides and the hourly heights. These readings were written onto paper forms and monthly mean values of the various tidal parameters, such as mean high water, mean lower low water, and mean sea level, were calculated manually from the tabulations.
Portable versions of the Standard Tide Gauge were also developed for short-term deployments (from a few days to a few months) during hydrographic surveys. These mechanical gauges had spring-wound clocks and used wax-marigrams (strip charts) as the medium on which a metal stylus traced a curve in response to the rise and fall of the tide. The marigrams had to be replaced every seven days and the tide curves were read manually from the strip charts and processed just as for fixed Standard Tide Gauges.
The Transition to to the Digital World

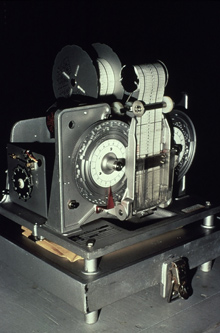
While Analog-to-Digital Recorder (ADR) gauge systems worked well, they had their limitations. Stations were subject to recording errors and marine fouling and were constantly in need of maintenance. In addition, the measurement and data processing equipment could not provide users with information until weeks after the data were collected. Click image for larger view.
In 1966, there was a major breakthrough in tide gauge technology with the introduction of the Analog-to-Digital (ADR) tide gauge. Like the Standard Tide Gauge, the ADR included a float and wire and a stilling well. However, the ADR used a punch paper tape system to record the water level every six minutes. Spring-wound clocks of the earlier analog gauges were replaced by solid-state battery powered timers. The punch paper provided a computer compatible data recording, compared with earlier analog gauges which drew lines on a paper chart. The ADR paper tapes were read by an optical reader and translated onto nine-track magnetic tape for loading onto a computer system for processing.
ADR gauges were transitioned into operation to replace the Standard Tide Gauge over a 10-year period, from 1966 to 1976. ADR gauges were used until 2003, when NOAA had fully transitioned to the Next Generation Water Level Measurement System.
The Important Role of the Tide Observer: The Human Connection
Although the tide gauge recorder technology slowly evolved over a century, the critical role of the tide observer did not. From the earliest tide observations using tide staffs only, tide observers were required to be diligent, accurate, and on-the-job at the right time, good weather or bad, and often in remote locations.
With the introduction of recording gauges, the tide observer no longer had to continually read a tide staff; however, they took on the more complex duties of keeping mechanical recorder systems in continuous operation. They still had to read the tide staffs once per day and also had to be skilled in clock repair and mechanical system repair and maintenance. Routine accurate tide staff readings were necessary to independently calibrate tide gauge readings and to reference them to the nearby land and reference benchmarks. Observers also had to carefully remove and replace marigrams once per month and mail them to headquarters in Washington, DC.
Many tide stations had the same tide observer for several years, and personal notes of these observers in recording the weather conditions and local events along with the tides provides a unique historical character to the world of tide observations.
Conclusion
The history of tide observation in the U.S. is as old and rich as the history of the U.S. Coast Survey itself. Tide observations, a necessary component of nautical charting and maritime operations, have made the slow transition to the revolutionary, fully automatic Next Generation Water Level Measurement System.
Careful attention to detail and a systematic and nationwide approach to tide observation have made long-term tide gauge records one of the most unique geophysical records in the U.S. The long-term continuous records produced by these gauges and tide observers have allowed the application of tidal data to other evolving NOAA missions, such as storm surge and tsunami warnings, climate and sea level rise, and habitat restoration.
Contributed by Stephen Gill, NOAA's National Ocean Service
