Managing Legacy Climate Data in the 20th Century
NOAA's National Climate Data Center (NCDC) is the world's largest active archive of weather data. NCDC produces climate publications, responds to data requests from all over the world, and operates the World Data Center for Meteorology and the World Data Center for Paleoclimatology. NCDC data are used to address issues that span the breadth of this nation's interests.
- Introduction
- A Time of Punch Cards
- A Time of Unification
- A Time of Great Risk
- Conclusion
- Works Consulted
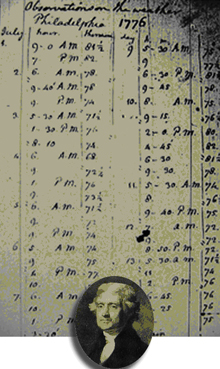
As our nation adopted the Declaration of Independence, the weather was so important to Thomas Jefferson that he made four observations on July 4, 1776. Billions upon billions of observations have been made since that time. Click image for larger view.
From storage rooms to hallways, punch card file cabinets containing the nation's archive of climate data filled every conceivable space at the National Weather Records Center (NWRC) in 1966, creating a maze for employees to maneuver through.
"[Punch cards] were stored everywhere, and over half a billion cards were on hand with new cards being generated every day," said Bill Haggard, NWRC Director from 1966-1975. "The sheer weight of such a huge and ever-increasing number of cards far exceeded the ability of the building's structure to support such a load." There was concern that the NWRC building was in imminent danger of a structural collapse.
Where did all these punch cards come from and why were they worth the risk? This article travels back to the early part of the last century to understand how and why NOAA has taken such care to manage climate data and why these data remain so important to our nation today.
A Time of Punch Cards: 1930s - 1940s
Punch cards, which are pieces of stiff paper that contain digital information represented by the presence or absence of holes in predefined positions, were a technical marvel when they came into prominence in the United States in 1890. Using these cards, it took one year to process data from the 1890 National Census. By comparison, it took seven years using manual methods to process data from the 1880 Census.
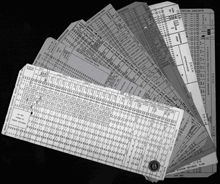
For those who do not remember, a punch card is a heavy paper card on which coded numbers or alphabetic characters were punched. Data were represented on the card by the presence or absence of holes in predefined positions. Many of the later cards were preprinted with a phrase that became part of the culture: "Do not fold, spindle, or mutilate." Click image for larger view.
Despite the utility of these cards, it was not until the Great Depression that funds were available to use punch cards for a mechanical analysis of weather statistics. A huge backlog of weather observations "had been gathering dust in Weather Bureau files," going back to the 1700s.
In 1934, under the Work Progress Administration (WPA), a project was started to prepare a long-needed atlas of the ocean climates using punch cards. The WPA was a program designed to provide work to those left unemployed during the Great Depression. Between 1936 and 1942, WPA resources were also used for punch card compilation and analysis of millions of surface weather and upper air observations from across the United States.
The WPA efforts were the start of a mammoth data management challenge to address the historical backlog of weather observations going back hundreds of years. As was written by the U.S. Air Weather Service in 1949, "The task of sorting and summarizing the data was so great that it was impossible to summarize more than a small fraction of the observations as they were received, to say nothing of treating the mass of data accumulated but untouched through the years."
World War II
Either through fate or foresight, the early WPA efforts allowed the United States to have some of the climate data needed for World War II. Overnight, Pearl Harbor made the problem of weather statistics one of first-order, top-drawer importance. Long-term climate averages and extremes could be the difference between success and failure when planning critical military actions. For example, when planning the "D-Day" invasion of the beaches of Normandy in June, 1944, planners needed to know when the weather would be right at a "particular beach-head, not just for planes, nor for landing craft, nor transports, nor armored trucks, nor infantry, but for all of these and every other element in a complicated landing operation upon which an entire campaign depends."
Because of this urgent need, early in 1942, the WPA civilian punch card project was quickly transformed into a support resource for the Armed Forces. By the end of the war, 80 million cards were punched, many from pre-war weather observation forms of other countries. These cards were summarized into products, such as flying weather and low visibility summaries, which were essential for military operations.
Both our allies and enemies had a strategic advantage during the war because they began their analysis of weather statistics much earlier than the United States. The British Admiralty began keying climate data in 1920 and the Deutsche Seewarte (German Marine Unit) began in 1927. Long-term climate averages and extremes were essential for the planning needed for critical military actions. After the war, both of these punch card sets, which had millions of ship observations that went back to the 1850s, were acquired along with many others by the United States.
These vast punch card collections, one set weighing 21 tons, were placed in large crates and sent to the newly created New Orleans Tabulating Unit. This unit was a joint Weather Bureau, Air Force, and Navy climate center established after the war to unify U.S. civilian and military records, observing methods, and data management procedures. There was much work to do and much data to place on punch cards to ensure that the United States would have access to weather and climate data in the future.
A Time of Unification: 1950s - 1970s
The unification of civilian and military climate data management following World War II eliminated the " confusing and time-consuming situation of having to go to several widely separated repositories to accumulate all available data for a specific project."
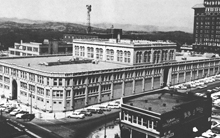
The Grove Arcade Building in Asheville, North Carolina, was the home of the National Weather Records Center, National Climatic Center, National Climatic Data Center, and the nation’s Climate Data archive from 1952 to 1995. Click image for larger view.
However, physical space necessary to store the growing punch card libraries was becoming a big issue in New Orleans. Starting in 1951, the entire New Orleans Unit gained much needed space by moving to Asheville, North Carolina. With the new home, the unit became the National Weather Records Center. The Air Force and Navy offices also moved, establishing a unified climate data archive.
The NWRC was designated as the official depository of all U.S. weather records by the Federal Records Act of 1950 and became the only Agency Records Center in the Department of Commerce. In 1957-1958, a World Data Center for Meteorology was co-located at the NWRC to facilitate the international exchange of scientific data collected during the International Geophysical Year.
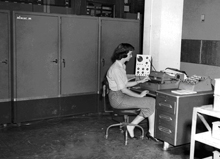
NWRC programmer Irma Lewis at the console of the ALWAC III computer in 1959. This early NWRC computer passed acceptance tests on July 1, 1955. It cost $85,000 and weighed 2,100 pounds. Click image for larger view.
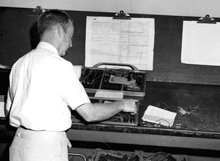
Early programming in the 1960s. NWRC employee Garland O’Shields performs complex wiring on an accounting machine plug board which did addition and subtraction calculations. Click image for larger view.
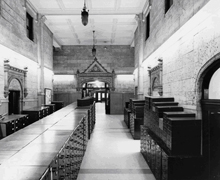
Punch card cabinets containing climate records were even stacked in the main entrance of the NWRC in the early 1960s. There was no other place to put them. Click image for larger view.
The 1950s saw the requirement for the design and acquisition of modern electronic calculating equipment, of sufficient capacity and input and output speeds to handle larger masses of data. so that more variables may be investigated simultaneously." These electronic data processing systems became known as computers and would work with the machines that produced, sorted, collated, and reproduced all the punch cards.
A Growing Collection
By 1960, the NWRC had accumulated 400 million punch cards. The collection grew by about 40 million cards every year, or over 100,000 cards per day. Storage space again became an issue and the punch cards were placed anywhere there was room. The floor load became excessive and cracks were noticed in building support columns.
Bill Haggard, NWRC Director at the time, said, "the basement was cleared; special platforms were built on the sloping basement floor; and card cabinets were stacked several deep in the basement, carefully unloading the stress of the upper floors in a sequence designed to reduce the weight in an orderly and symmetric manner."
This was only a temporary solution. The alternatives for a more permanent solution were to find new storage space, dispose of some cards, or latch onto a technological breakthrough. Although some cards were destroyed, the answer lay in a new technology, another major Census Bureau innovation called "FOSDIC."
Film Optical Sensing Device for Input into Computers
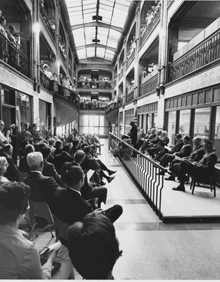
A major event was the 1968 dedication of twin RCA Spectra mainframe computers for the NWRC and the Air Force. The computer room is visible to right protected by bullet proof glass. Punch card cabinets are still on the floor above. Click image for larger view.
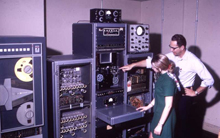
National Climatic Center employees Ray Erzberger and Dale Lipe at FOSDIC II, circa 1974. The center computer is reading 16-millimeter FOSDIC film and the tape drive on the left is recording the card images on a nine-track tape. Click image for larger view.
FOSDIC, short for "Film Optical Sensing Device for Input into Computers," was developed in the 1950s by the U.S. Census Bureau and the National Bureau of Standards to improve the processing speed of the U.S Census. In the 1960s, a variation of FOSDIC was used for the nation's climate records to store photographic images of punch cards on 16-millimeter film.
Even though this resulted in a 150-to-1 savings in physical storage space, access became more limited since new punch cards had to be reprinted from the film in order for the data to be used by card reader machines. It was not until the 1970s that a second modified FOSDIC machine was developed to transfer the card images from film directly to magnetic tape that could be read by a mainframe computer.
Migrating Punch Cards
Migrating punch cards to film and eventually magnetic tape was tedious and expensive. At the same time, technology was at the beginning of an exponential increase in scope and complexity. The resources to upgrade to the quickly changing computer environment were competing with the challenges of managing the historical archive that was based upon almost 100-year-old punch card technology. Compounding this was an even larger data management challenge on the horizon that would take decades to resolve—the challenge of data rescue.
A Time of Great Risk: 1980s - 1990s
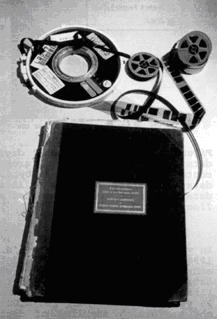
Archive media in the 1980s in need of data rescue. Clockwise from top: nine-track tape, 16-millimeter film, 35-millimeter film, and a 1870s logbook.
In the 1980s, much of NOAA's climate data legacy was at great risk due to aging storage media. Hundreds of thousands of magnetic tapes were older than their useful life and nearly 100,000 reels of microfilm were fading away and emitting an unhealthy acetic acid gas, referred to as the "Vinegar Syndrome." More than 200 million manuscript pages of climate records were locked away in hundreds of thousands of archive boxes with only the corporate knowledge of a few employees who knew what was inside or where they were stored. Efforts now focused on data rescue, which involved the migration of data to modern media with better accessibility.
Growing Data, Growing Needs
Compounding the need for data rescue were the expectations from the new data streams that would result from NOAA's modernization efforts. Observations from the latest weather radars, called NEXRAD, produced an overwhelming amount of new climate data. Huge amounts of environmental satellite data, previously stored as film images, were now digitally stored on magnetic tape. Words like terabytes (1 million megabytes) now entered the data manager's vocabulary at a time when the media to store them only held megabytes (1 million bytes).
Considering that just 20 years prior, the primary archive media was an 80-byte punch card, there were grave concerns about whether there would be enough resources to even process the new data, let alone even resources for data rescue.
During this time, there was also a growing concern about climate change and an increased awareness of climate impacts on humans and also of the impacts of human activity on climate. Similar to the early years of World War II, the nation was not ready with highly accessible climate data that were needed to address these issues. Dr. Ken Hadeen, Director of the National Climatic Data Center (NCDC) from 1984-1997, oversaw the data rescue efforts and poised the nation's climate archive for the fast-approaching requirements needed by the Internet and climate change issues.
The Earth System Data Information Management Program
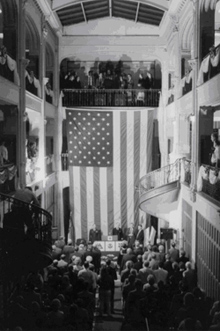
A last time to celebrate before moving to a new building in 1995: NCDC Director, Dr. Ken Hadeen (second from right on the podium), presides over a 1990s employee appreciation day. Click image for larger view.
Working through a 1990 initiative called the Earth System Data Information Management (ESDIM) program, key funding was provided to rescue and modernize access to NOAA's climate archive. In 1995, a new Federal Climate Complex building was completed that had state-of-the art environmental controls designed for data archives.
Hadeen, reflecting upon his time as NCDC Director, said, "Rapid advancement in electronic communications and automation technology coupled with dedicated and talented employees resulted in automated inventories, objective and reproducible quality control procedures, automated publication of monthly reports, and detailed metadata about the history, observing practices and instruments, and changes in locations of observing sites. These advancements set the stage for the future assimilation of the fire hose of data that would soon be acquired in real time." It also set the stage for the unquenchable need for information that was just beginning via the Internet.
Conclusion
Today, NOAA operates National Data Centers for climate, geophysics, oceans, and coasts. Through these Data Centers and other centers of data, NOAA provides and ensures timely access to global environmental data from weather satellites, radars, and other observing systems; provides information services; and develops science products. These data and products are the foundation for much of the work that NOAA does, providing the information needed to meet the challenges associated with protecting our oceans, coasts, and skies.
Contributed by Pete Steurer, NOAA's National Environmental Satellite, Data, and Information Service
Works Consulted
Barger, G.L. (Ed.) (1960). Climatology at Work, measurements, methods, and machines [Electronic version]. Washington, DC: National Weather Records Center.
National Climatic Data Center. (2001). Celebrating 50 Years of Excellence. Asheville, North Carolina.
Steurer, P.M. (1995). Data rescue at the National Climatic Data Center, progress and challenges [Electronic version]. Asheville, North Carolina.: National Climatic Data Center.
U.S. Air Weather Service (1948). Machine Methods of Weather Statistics [Electronic version]. New Orleans, Louisiana: U.S. Air Force Data Control Unit.
U.S. Air Weather Service et al. (1949). Machine Methods of Weather Statistics, 4th Ed. [Electronic version]. New Orleans, Louisiana: the Machine Tabulating Units of the U.S. Air Force/Air Weather Service, U.S. Department of Commerce/Weather Bureau, and U.S. Navy/Aerology Section.
