Changing Technology for Real-Time Tide Measurements
Tides and water levels play a major role in the lives of those living, working, or sailing along our nation's coasts. Recent strides in technology have revolutionized NOAA's ability to provide accurate and reliable tide and water levels in "real-time." This has increased the number and variety of customers using this information, including the National Weather Service, coastal managers, vessel captains, and recreational boaters. NOAA is continuing to enhance and expand tide and water level products to meet the needs of this expanding user community.
Just as the sun rises in the east and the stars come out at night, we can be confident that the ocean waters will regularly rise and fall along our shores, making tides one of the most reliable phenomena in the world. While we can all casually observe tides via the recurrence of high and low water along the seashore, NOAA and its predecessor organizations have maintained systematic tidal records for 200 years.
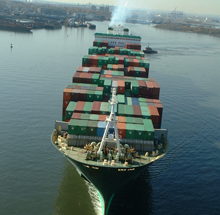
Mariners rely on tidal information in navigating our coastal waterways. Click image for larger view.
This precise knowledge of the times, heights, and extent of inflow and outflow of tidal waters is critical to a wide range of practical purposes such as navigating waterways; constructing bridges, docks, and breakwaters in harbors; and selecting the best times for recreational fishing, boating, surfing, and other water sports.
In recent years, the technology available to measure water levels has increased NOAA’s ability to collect and deliver this information to those who need it. This story traces the breakthroughs in tide measurements in recent years…from gauges that collected data on punch paper tape and were processed manually on a monthly basis…to gauges that automatically transmit electronic data every six minutes via satellite.
The Way It Was: Analog-to-Digital Tide Gauges
In the late 1980s, NOAA was still using Analog-to-Digital (ADR) water-level measuring systems to measure water levels. Developed in 1976, ADR gauges were a major breakthrough in tide gauge technology. Like previous gauges, the ADR still included a float and cables. However, unlike earlier gauges, the ADR used a punch paper tape system to record a number that represented the water level. Although the float-driven ADR required a tide observer to visit the gauge several times a week, the gauge did provide computer compatible data recording (unlike earlier gauges, which drew lines on a paper chart).
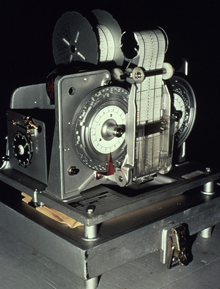
The Analog-to-Digital float-driven tide gauge used a punch paper tape system to record water level. Click image for larger view.
The ADR system used a recorder driven by a float in a “stilling” well. A stilling well calms the waters around the water level sensor, to allow an accurate reading. A typical stilling well consisted of a 12-inch wide pipe. Inside the stilling well, an eight-inch diameter float was hung by wire from the recording unit above. The entire gauge was located inside a small tide house.
Water level data were recorded on punched paper tape at six-minute intervals (five-minutes for the Great Lakes). Timing of recordings was controlled by a timer, accurate to one minute per month. Observers maintained and adjusted the timers and calibrated the gauges with the tide readings. Observers also collected records and mailed them to NOAA headquarters for manual processing one time each month. Tide stations were visited annually to maintain the tide houses and clean biological fouling from the underwater surfaces. During these annual visits, gauge components and support structures also were checked for stability.
Although these systems worked well, they had their limitations. Stations were subject to recording errors and marine fouling and were constantly in need of maintenance. In addition, the measurement and data processing equipment could not provide users with information until weeks after the data were collected.
The Way It Is: The Next Big Step - Microprocessors and Satellites
The implementation of the NOAA Next Generation Water Level Measurement System was a multi-year initiative (1980-2000) that revolutionized the ability of the NOAA National Water Level Program (NWLP) to meet customer needs. The initiative fundamentally changed and modernized the way water level data were measured, collected, quality-controlled and processed, managed and archived, and disseminated to users.
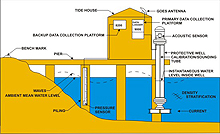
This schematic depicts a typical Next Generation Water Level Measurement System tide station. Click image for larger view.
Water level measurement sensor systems were changed from the float/wire stilling well systems of the past to newly engineered air acoustic and pressure systems that reduced known error sources of the old systems. The new system configuration underwent extensive laboratory and field testing prior to implementation and side-by-side operation with the old systems prior to their independent operation. This testing ensured continuity of the long-term tidal record.
The new water level sensors can be directly leveled to local survey marks, so that local observers are no longer needed. The new systems include an electronic data acquisition system. Instead of paper tape, the data are now stored in computer memory chips. These systems were designed to operate unattended for a full year without requiring maintenance. In addition, the new systems collect a wide variety of environmental measurements such as wind speed, air and water temperature, barometric pressure, and conductivity.
Another major advancement with this system is how water level data are now sent back to NOAA headquarters for processing. Instead of mailing a data tape once a month, data are transmitted over the Geostationary Operational Environmental Satellite (GOES) system every three hours. Headquarters automatically receives the satellite transmissions just minutes after it is transmitted from the gauge. Data quality control and processing are automated, eliminating the manually intensive and time-consuming review of strip charts, and the punch paper tapes that required conversion to digital format.
A Network of More than 200 Coastal Observing Stations
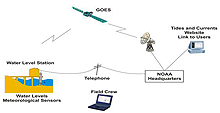
This illustration shows the typical path for Next Generation Water Level Measurement System data to ultimately travel to NOAA Headquarters where it can be processed. Click image for larger view.
The NWLP consists of a baseline National Water Level Observation Network of more than 200 remote continuously operating water level stations around the U.S. coasts, the Great Lakes, and the Pacific Islands. NWLP also includes a changing network of short-term water level stations used for specific projects. The NWLP provides a wealth of marine observations from major ports and harbors as well as from remote coastal stations.
Timely Data Used by a Wide Variety of Users
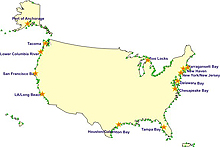
This map shows the current location of National Water Level Program water level stations. Stars on the map represent Physical Oceanographic Real-Time Systems (PORTS®) that reside in major U.S. harbors. Click image for larger view.
The move to the new technology has transformed the products and services which are provided to NOAA’s customers. The availability of preliminary water levels has improved from a few months to near-real-time (every six minutes to an hour). The availability of monthly verified tide and water level products has improved from several months to one month. Plus, the systems also provide ancillary data such as air/water temperature, winds, and barometric pressure.
NOAA, like much of the rest of the world, is using the Internet as a primary method to deliver information. Data from NOAA water level stations and other environmental systems are readily available online.
The real-time data provided by NOAA is now applied by a wide variety of users, including NOAA's National Weather Service to support their Storm Surge and Tsunami Warning programs. The National Weather Service local forecast offices and the West Coast/Alaska and the Pacific Tsunami Warning Centers continuously monitor water level information to help them make decisions about issuing warnings of potential dangers to coastal communities.
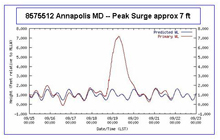
This graph shows the storm surge at Annapolis, Maryland associated with Hurricane Isabel. Click image for larger view.
The maritime community also relies heavily on the information provided by these systems to improve navigation safety and efficiencies. Having real-time water level information can allow vessels to add additional cargo because mariners know that there will be adequate water depth for their ships to safely transit out of port. Recreational boaters are also frequent users of tide information, to help plan fishing outings around the moving tides and perhaps to improve their chances of catching the big one!
What’s Next?
NOAA will complete the next upgrade of the water level network data collection systems in 2007, replacing the systems from the 1980s that have served well but are now at the end of their life cycles. This upgrade, in addition to providing expanded capabilities, transmits marine observations over GOES every six minutes, further enhancing the timeliness of this critical information.
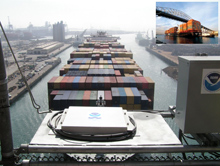
An air gap (bridge clearance) sensor was installed on the Gerald Desmond Bridge, in Long Beach, California, to help ships know whether or not they can safely pass underneath the bridge. Click image for larger view.
NOAA is also building on the technology foundation developed for the water level network to provide an expanding suite of oceanographic and environmental information to the public. Recent developments include microwave “air gap” sensors that mount on bridges over navigation channels and provide ship captains a direct measurement of the clearance under bridges, helping them determine if it is safe to pass.
Because of its ease in deployment and reduced maintenance requirements, the microwave technology used for the air gap systems is being tested as the possible next water level sensor for the NWLP. NOAA is also planning on using these measurement platforms to monitor water quality and other environmental parameters.
Conclusion
NOAA has come a long way over the past two decades, providing more accurate and timely water level and other oceanographic information to the public. Technology has allowed us to transform our measurement program from punching holes in paper tapes mailed monthly to measurements updated every six minutes and delivered via satellites. We continue to push the technology to provide users with more types of information for the ever-growing applications of coastal marine observations.
Contributed by Thomas Mero, NOAA’s National Ocean Service
