
 Surveying—Past and Present
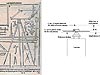 Instrument Diagrams
 Outdoor Life
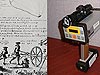 Measuring Distances
 Getting There…
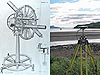 Surveying Equipment
Instrument Diagrams
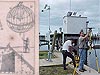
Diagrams and sketches, such as the two shown here, can serve to illustrate details of equipment used during surveying. The image on the left was recorded on vellum and paper in the 1600s to illustrate an array of surveying and engineering instruments. By comparison, the image on the right is a digital image, generated on computer; however, it serves a similar purpose as the hand-drawn companion imageto help viewers gain a clearer understanding of equipment.

Left-hand image courtesy of the Treasures of the NOAA Library Collection, archival photographer Sean Linehan.
That Was Then…
Daniel Schwenter (1585-1636) was known as a mathematician, inventor, poet, linguist, and librarian. A professor of both oriental languages and mathematics at the University of Altdorf in Nuremberg, Germany, his wide-ranging interests and studies of the human eye led to his development of the scioptic ball. The scioptic ball is a universal joint that allows a microscope mounted on the ball to be swiveled into any position.
This illustration of an assemblage of surveying and engineering instruments appears on Page 5 of Book 3 of Schwenter's work entitled "Geometriae practicae novae et auctae tractatus I[-IV]." This book was published posthumously in 1641. A copy of the book is in the NOAA Central Library rare book collection.
…This Is Now
The exact point whose position is being measured using Global Positioning System (GPS) technology is generally assumed to be what is called the "phase center" of the GPS antenna. This is not a physical or stable point, however. Phase center variations affect the antenna offsets that are needed to connect GPS measurements to physical monuments. Ignoring the variations can result in vertical errors of up to 4 inches (10 centimeters). NOAA's National Geodetic Survey (NGS) provides an antenna calibration service for GPS equipment at its facility in Corbin, Virginia. The service uses field measurements to determine a relative phase center position and phase center variations.
Even in the digital age, sketches and diagrams still serve a purpose. Calibration results are published to the NGS Web site, and a good, old-fashioned diagram is provided for each not-so-old-fashioned antenna calibrated. The diagrams are still produced by computer and provided in digital format, however!
The image shown here is provided to show users how the average phase center offsets of reference antennas are determined on the Corbin test piers. The view is "edge on" to an antenna.
About the Images
Past Image
- Date: 1641?
- Material: Hand-drawn image on vellum and paper
- Source: Geometriae practicae novae et auctae tractatus III, by Daniel Schwenter
- Instrument/technique shown: 17th century drafting/map making instruments
Present Image
- Date: Not available
- Material: Digital image file (GIF)
- Source: GPS Antenna Calibration at the National Geodetic Survey, by Gerald Mader
- Instrument/technique shown: Measurements used to determine GPS antenna phase center offsets
Works Consulted
Answers.com. (2006). Daniel Schwenter. Retrieved on August 9, 2006, from http://www.answers.com/topic/daniel-schwenter
Mader, Gerald L. "GPS Antenna Calibration at the National Geodetic Survey." Retrieved March 13, 2007, from http://www.ngs.noaa.gov/ANTCAL/images/summary.html
Related Web Sites
NOAA's National Geodetic Survey