Vertically Challenged: The Progression of Vertical Datums
Vertical datums are used as a reference against which to base height measurements in order to know that all measurements start from the same “zero” and can therefore be compared. NOAA’s National Geodetic Survey has been in the business of establishing national vertical datums throughout the history of the organization.
- Introduction
- An Expanding Network
- The First Vertical Datums
- Vertical Datum of 1988
- Incorporating Modern Technology
- Conclusion
- Works Consulted
It’s hurricane season and there is a storm surge of 20 feet heading for your house. You know the elevation of your house is 35 feet, but does that mean that your house will be 15 feet above the water? Not necessarily. To be certain, you need to know what reference—or vertical datum—the elevation of your house and the height of the storm surge are based on.

Photo of storm surge flooding at Horseshoe Beach, Florida, associated with Tropical Storm Alberto on the afternoon of June 13, 2006.
Vertical datums are used by surveyors, engineers, map-makers, planners, and others as a reference against which to base height measurements in order to know that all measurements start from the same “zero” and can therefore be compared. The vertical datum used to determine elevations has been revised several times throughout the history of the National Geodetic Survey (NGS), as knowledge of our Earth and science expanded. However, the basic approach to determining elevation has remained almost unchanged throughout that history.
An Expanding Geodetic Leveling Network
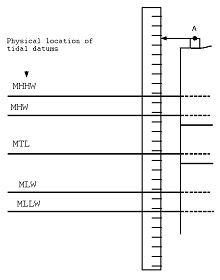
Tide gauges are used to record water levels over long time periods. From collected data, NOAA determines Mean Sea Level (MSL), Mean High Water (MHW), and Mean Lower Low Water (MLLW). From these data and leveling, elevations can be derived for benchmarks. This graphic shows examples of different levels at a tide station measured relative to MLLW.
Datums are reference, or “starting,” points for vertical surveys. More specifically, a vertical datum is a reference against which elevations and depths are measured. One type of datum is based on tides and another, called a geodetic datum, is determined by measuring and monitoring the size and shape of the Earth and the location of points on its surface. Vertical geodetic datums are determined by geodetic leveling and are often tied to tide gauges.
The first geodetic leveling project in the United States was surveyed by the Coast and Geodetic Survey (C&GS) from 1856 to 1857. The project was headed by G. B. Vose who conducted the leveling to connect tide gauges along the Hudson River, from New York City to Albany. Vose set benchmark GRISTMILL during this project which, in 1875, was used by the U.S. Lake Survey to determine the elevations of the Great Lakes.
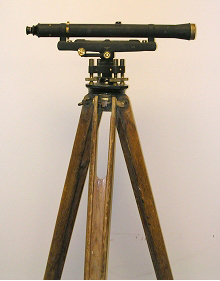
Spirit levels were an early tool of leveling that are still used today.
To expand the geodetic leveling network, C&GS received approval from Congress for a national geodetic project. During the analysis of the project, it became apparent that high-accuracy leveling would be necessary. The first official request for the funding of a leveling project came in 1876. The first benchmark established as part of this project was Bench Mark “A” set in Hagerstown, Maryland, in 1887.
Using the Hagerstown benchmark as a starting point, benchmarks were set westward to assist in leveling the wild terrain. This enormous leveling undertaking supplemented the transcontinental arc of triangulation that followed the 39th parallel from Delaware across the country to California from 1877 to 1900. The data that surveyors gathered were extremely accurate given the tools they had and the conditions they endured.
The First Vertical Datums
As more and more data became available, elevation data sets were combined and adjusted. These adjustments were necessary to ensure that the whole country’s leveling was based on the same system.
Adjustments were made by C&GS in 1900, 1903, 1907, and 1912. To complete the first general adjustment in 1900, data from the C&GS, the U.S. Army Corps of Engineers, the U.S. Geological Survey, the Massachusetts Topographic Survey, and the Pennsylvania Railroad were all combined. Local mean sea level at five tide gauges was held fixed. Once all of the data were based on the same datum, the organizations could reference each other’s data.
As more and more level lines were run, readjustments were completed. Each adjustment was better than the previous one due to the inclusion of more data and more loops of level runs (for error checks) and better weighting of the data based on information gained in previous adjustments. In 1903, local mean sea level was held fixed at eight tide gauges, then at eight gauges again in 1907, and at nine gauges in 1912.
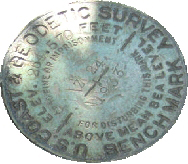
Benchmarks, such as this geodetic benchmark, are permanent markers with a precisely known vertical elevation determined by a surveyor. Tidal benchmarks, slightly different in design, are positioned near tide gauges so they can act as a permanent record of the water level datums of that tide gauge.
The 1900 adjustment fixed the elevation of 4,200 bench marks and contained about 21,000 kilometers of leveling. The 1907 readjustment was undertaken because the first transcontinental leveling had been completed and the tide gauge in Seattle, Washington, was included. The 1912 adjustment contained about 11,100 bench marks and over 46,000 kilometers of leveling.
The Sea Level Datum of 1929
The Sea Level Datum of 1929 (SLD 29) added more U.S. data and also Canadian data. SLD 29 held local mean sea level (MSL) fixed at 26 tide gauges, including five in Canada, as opposed to the previous adjustments which were based on five, eight, or nine gauges.
These tide gauges used water-level data recorded over a period of about 19 years to determine local values for MSL, mean high water (MHW), and mean lower low water (MLLW) at each station. This local MSL is the mathematical mean of hourly heights observed over the 19-year time span. Because there are two different low tide levels, the MLLW represents the mathematical mean of the lower low tide over the same 19-year time span. The important thing to remember about tidal levels is that they are only valid for a local area.
C&GS personnel realized that holding local mean sea level fixed at 26 locations would result in discrepancies since it was well known that mean sea level differed from location to location. However, the decision to hold the 26 gauges fixed was made using the assumption that the variations were probably about the same magnitude as observational errors, and that the fixed sea level would help avoid confusion amongst users if benchmarks near the coast did not agree with local mean sea level.
The general adjustment of 1929 established SLD 29 as the entire country’s vertical control datum, which meant that all elevations would be determined as heights above SLD 29. The datum was later renamed the National Geodetic Vertical Datum of 1929 (NGVD 29) to account for the geodetic aspect of the datum. Renaming the datum, however, did not correct the problem of differing local mean sea level values. Despite known deficiencies and distortions, NGVD 29 was the official U.S. datum for vertical surveying until the North American Vertical Datum of 1988 was released in 1991. In fact, some data sets today are still based on NGVD 29.
The North American Vertical Datum of 1988
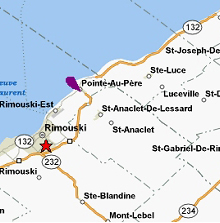
Tide station U.S. vertical readings are based on Father Point, in Rimouski, Quebec. The purple teardrop in the image represents the location of the benchmark.
North American Vertical Datum of 1988 (NAVD 88) is a newer and more accurate model, referenced to a single tide station, Father Point, in the town of Rimouski, Quebec, in Canada. Because NAVD 88 is referenced to one single point, contains more data (625,000 kilometers of additional leveling), and was calculated using rigorous mathematical models, it contains fewer distortions than earlier vertical datums Fewer distortions result in more accurate elevations. A readjustment was also necessary because many of the benchmarks used for NGVD 29 had changed in elevation due to crustal motion caused by earthquakes, post-glacial rebound (uplift), and oil and water extraction (subsidence).
Currently, NAVD 88 is the official vertical datum for the United States, against which federal agencies measure elevations.
The International Great Lakes Datum of 1985 (IGLD 85) is the vertical reference for the Great Lakes, and is also based on Father Point. However, slight differences in the definitions of their heights make IGLD 85 and NAVD 88 close but not equal.
Today, elevations derived from leveling can be uniform, regardless of whether you are near the Atlantic, Pacific, or Gulf coast and very close for the Great Lakes coast.
Incorporating Modern Technology
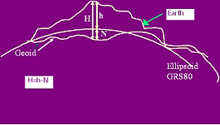
A geoid is mathematically defined surface which (approximately) coincides with the mean ocean surface. It is often referred to as a close representation or physical model of the figure of the Earth. Click image for larger view.
The face of our Earth is covered with valleys, mountains, and cliffs, so it is far from the smooth, regular surface often represented by globes. Specific elevations have been determined for many benchmarks across the Earth’s uneven surface. However, surveying computations cannot be made on such an irregular surface because it would be mathematically impossible. The elevations of these benchmarks are actually referenced to the geoid. The geoid is a model, developed by scientists to represent an equal-gravity surface that approximates mean sea level.
For most purposes, the geometrical figure which most accurately matches the surface for the Earth is an ellipsoid. An ellipsoid is an ellipse which has been rotated around its shorter axis to form a solid figure. Mathematical computations can be carried out on the ellipsoid, referencing one point to another, because the ellipse is a smooth, definable surface, meaning that it can be represented by an equation. The Global Positioning System (GPS) uses the ellipsoid as its reference and produces heights above the ellipsoid. However, the elevations normally used by surveyors and engineers and shown on maps are called orthometric heights and are heights above the geiod. Orthometric heights are used on maps and by most people on a daily basis because they show the actual dips, bumps, and gullies of the Earth, and accurately show which way water will flow. Therefore, GPS height values must be converted from heights above the ellipsoid to heights above the geoid.
NGS has developed mathematical models to make the conversion from GPS values (referenced from the ellipsoid) to orthometric heights (referenced to the geoid). GEOID03 is the NGS model currently used to allow changes from ellipsoidal heights to orthometric heights and which facilitates the use of GPS to determine accurate elevations.
VDatum
Coastal elevations can come from a variety of sources and may be based on a variety of datums. To combine or compare coastal heights and depths from different sources, these elevations need to be referenced to the same vertical datum. “VDatum” is a transformation tool developed by NOAA to transform coastal elevations between 28 different vertical datums, including tidal, orthometric, and ellipsoidal datums.

This illustration shows an example of how much storm surge can affect sea level and how Vdatum technology could help avoid associated surge damages. Click image for larger view.
With VDatum, orthometric heights on land and sea-floor depths based on MLLW can be based on the same datum, making maps more accurate and simpler to use. VDatum can allow scientists to better define flood plains and better model the impact of a hurricane or heavy downpour, which have the potential to raise water to destructive levels. With land and sea-depth data referenced to the same datum, researchers can better predict the size and effect of storm surges, and therefore how large of an area needs to be evacuated during a natural disaster for the safety of the population.
VDatum is only available for a few place in the United States. Currently, parts of New York, New Jersey, Delaware, North Carolina, Louisiana, Florida, California, and Washington are the only places along the coast that have the computer modeling necessary to support VDatum.
Conclusion
So, the question remains: Will your house flood if it is at an elevation of 35 feet and a storm surge of 20 feet is predicted for your area? You know that the house elevation is above mean sea level. How does the storm surge height relate to mean sea level? Storm surges are given as an amount above the normal water level. If the tide level at the predicted time of the surge is high tide, say 10 feet above MLLW, then it is about 5 feet above MSL. We then add the 20-foot surge to the 5-foot height of the high tide and arrive at a water height of 25 feet above MSL, or 10 feet less than the elevation of the house. Your living room will stay dry…provided that the elevations you’ve been given are accurate!
The vertical geodetic network has improved immensely since its rudimentary beginnings. Vertical datums have improved over time with the help of NGS and ever-improving technology and elevation information. The development of GPS came with a new set of problems to be solved if GPS was to reach its true potential. NGS pioneered the models and routines for converting the ellipsoidal heights that GPS produces to the orthometric heights used by the everyday person. Their system has made GPS as useful and successful as it is today. VDatum software can synchronize coastal elevations to provide a safer future in terms of natural disasters.
Knowing about vertical datums can save your house as well as towns, bridges, and roads. NGS will continue to develop practical uses for surveying technology for the next 200 years, just as it has for that last 200.
Contributed by Aria Remondi, NOAA’s National Ocean Service
Works Consulted
American Society of Civil Engineers, American Congress on Surveying and Mapping, and American Society for Photogrammetry and Remote Sensing, comps. (1994). Glossary of the Mapping Sciences.
Berry, R. M. (1976). History of Geodetic Leveling in the United States. NGS. 137-151.
Dracup, J. F. Geodetic Surveys in the United Sates: The Beginning and the Next One Hundred Years [electronic version]. NGS.
Mendenhall, W. C. (1899). The United States Coast and Geodetic Survey Report 1899. 239.
National Geodetic Survey. (2006). National Geodetic Survey Web site. Retrieved August 30, 2006 from http://www.ngs.noaa.gov
NOAA. (1986). Geodetic Glossary.
Zilkoski, D.B. (2007). Digital Elevation Model Technologies and Applications: The DEM Users Manual, 2nd Edition. In D. F. Maune (Ed.), Vertical Datums (Chapter 2).
Zilkoski, D. B., Richards H. J., & Young M. G. (1992). Results of the General Adjustment of the North American Vertical Datum of 1988. NGS. 1-2.
