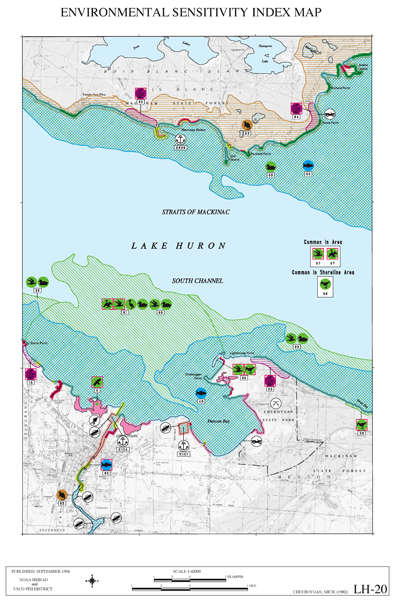
GIS technology allowed a more refined representation of the shoreline sensitivity values and greater detail of other resources at risk. Biology was now presented as polygonal areas of extent and details on the species represented and their seasonality was presented on the back of the map. This is an example from the Lake Huron ESI atlas prepared in 1994.

