
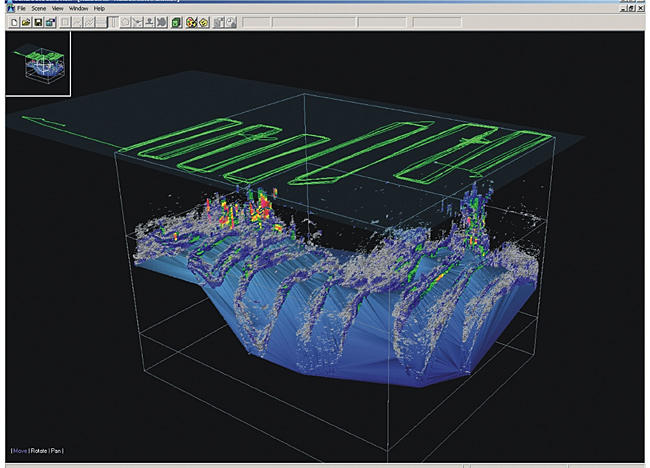
This image shows the three-dimensional distribution of widow rockfish schools overlayed on bathymetry (blue surface) off the coast of Oregon, as observed using scientific echosounders. The green lines represent the vessel track and the acoustic energy is represented on a color scale with grey denoting low fish density to red denoting high fish density.
High resolution available. (667Kb, 2754x1983).