
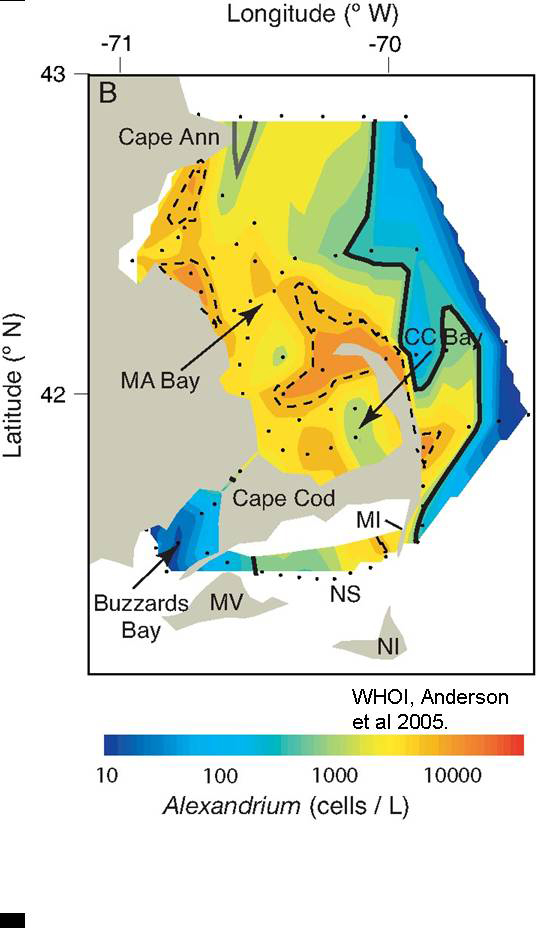
Contour plots show the distribution of Alexandrium cells as estimated using molecular probe technology during June 2-4, 2005. The dashed lines indicate the 10,000 cell L-1 contours and the solid lines indicate the 1,000 cell L-1 contours (Figure from Anderson et al., 2005). Alexandrium abundance data are of great value to state coastal managers. These data help managers to focus toxin sampling in newly exposed areas as well as in areas that could possibly be reopened for shellfish harvesting.