The Seaward Deflection of the Gulf Stream at the Charleston Bump
NOAA's CoastWatch Program processes near real-time oceanographic satellite data and makes it available to federal, state, and local marine scientists, coastal resource managers, and members of the general public. The roots of the CoastWatch Program can be traced back to the 1970s, with the advent of satellite information and the discovery of an ocean eddy off the coast of South Carolina.
- Introduction
- Drifting the Gulf Stream
- Satellites to Study the Ocean
- Solving the Mystery
- An Overhead Ocean Sentinel
- Works Consulted
On July 25, 1969, a free-drifting, manned submersible became trapped in an eddy near the ocean bottom off Charleston, South Carolina. The submersible Ben Franklin, named for the American patriot and scientist, had set adrift from Florida 11 days earlier to study and explore the Gulf Stream current. When the vessel surfaced in the eddy, its support ship towed the submersible back into the Gulf Stream to resume its northward drift. However, the mystery surrounding the eddy, unknown up to that time, was not solved until 1976.
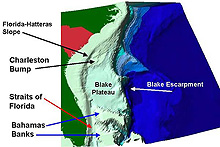
The Charleston Bump is a deep-water, rocky bottom feature on the Blake Plateau southeast of Charleston, South Carolina. Click image for larger view.
At this time, images from a NOAA satellite, combined with other observations, revealed that a large feature on the ocean bottom named the “Charleston Bump” diverted the path of the Gulf Stream, helping to create a large ocean eddy. This use of satellite information technology demonstrated the value of ocean observations from space and served as a forerunner to NOAA’s CoastWatch, a program that provides near real-time satellite images of physical and biological ocean phenomena.
Drifting Along the Gulf Stream
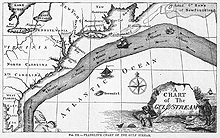
Alexander Agassiz, a preeminent oceanographer of the 19th century, attributed the first scientific basis for exploring the Gulf Stream to American statesman Benjamin Franklin. Franklin published this map of the Gulf Stream in 1769, 200 years before a submersible named after him drifted below the surface to study this river in the ocean. Click image for larger view.
While the Spanish explorer Ponce de León first formally identified the Gulf Stream in 1513, Benjamin Franklin was one of the first to describe and chart this strong, northward flowing current off the east coast of North America in 1769. This information was extremely helpful to sailors who used the current to cross the Atlantic in sailing ships.
Two hundred years later, in July 1969, a manned submersible named the Ben Franklin drifted over 1,400 nautical miles of the Gulf Stream at depths between 180 and 610 meters while conducting oceanographic studies. Starting on July 14 from West Palm Beach, Florida, the submersible began drifting north.

The Ben Franklin submersible was 20 feet tall and nearly 50 feet long. Six men drifted with the vessel on its Gulf Stream Drift Mission for 30 days. This mission included a brief period when the vessel became entrapped and unable to extricate itself from an ocean eddy. Click image for larger view and image credit.
Near Charleston, South Carolina, at a depth of over 200 meters, swirling currents in an eddy that spun off from the Gulf Stream trapped the vessel. The small motors used to guide the craft were too weak to allow it to move out of the eddy. Once the submersible surfaced, its support ship, the M/V Privateer, attached a line to the vessel and towed it to more favorable currents. The submersible then drifted under water all the way to the Grand Banks off of Newfoundland, Canada, where the journey ended on August 14.
At any other time, this would have made a sensational news story. But, the event was overshadowed by the first moon landing on July 20, 1969. The cause of the Ben Franklin’s entrapment near Charleston remained a mystery and was soon forgotten.
Using Satellites to Study the Ocean
Ironically, the lunar landing helped to solve the mystery of what happened to the Ben Franklin because the space program accelerated the development of satellites to monitor the weather and eventually the oceans, land, and vegetation on Earth. Meteorologists were the first to push for improvements in satellite observations to monitor weather. To gather this new “remote sensing” data, NOAA and NASA established a satellite service to build and launch satellites equipped with sensors, collect satellite data, transform the data into images, and distribute the images and data to the National Weather Service. However, during the first decade of satellite observations, between 1960 to 1970, the quality of the images was too poor to resolve the patterns at the surface of the oceans that appeared intermittently between the clouds.
In 1972, a NOAA polar-orbiting satellite with a high-resolution infrared scanner provided the first detailed views of the oceans in cloud-free areas. This satellite offered images at a one-kilometer resolution near the coastline of the United States. From the surface temperature patterns detected by the satellite’s scanner, the images revealed ocean currents such as the Gulf Stream flowing north from Florida to the North Atlantic off of Newfoundland where the current splits into several other currents. The images also revealed the Loop Current in the Gulf of Mexico.
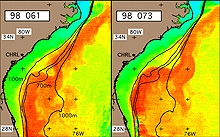
Satellite images show that the warm waters of the Gulf Stream current (orange) deflect consistently seaward soon after passing over a broad, prominent rise on the ocean bottom and spin off into an eddy (bottom center) that trapped the Ben Franklin submersible. Click image for larger view.
One intriguing temperature pattern appeared repeatedly in satellite images of the South Carolina coast. The pattern revealed a sharp eastward turn of the warm waters of the Gulf Stream in nearly the same location in each image. To gain a better understanding of this phenomenon, specialists enhanced the satellite images and then overlaid them on a map of bottom-depth contour lines. By overlaying the satellite images on bottom topography, scientists learned that the Gulf Stream’s sharp eastward turn coincided with a prominent rise or geologic feature on the ocean bottom known as the “Charleston Bump.” The procedures used by scientists are commonplace today, but, at that time, they required considerable effort.
Solving the Mystery of the Charleston Bump Eddy
So how would such a bottom feature contribute to formation of an eddy that would trap the Ben Franklin submersible? In the 19th century, Alexander Dallas Bache, the second superintendent of the U.S. Coast Survey, predicted that the irregular ocean floor off the coast at Charleston could create an eddy in the Gulf Stream. Later, in 1923, the scientist G.I. Taylor experimented with the flow of water in a rotating container. He demonstrated that a bump on the bottom of a rotating container forces all the water flowing above it to curve around the bump. It is as if there is a solid column obstructing the current and not just a small bump. Since the water column moves in a counter-clockwise direction around the bump, a stationary eddy will appear above the bump.
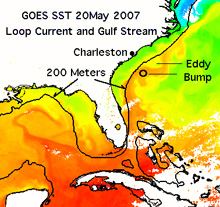
This satellite image shows daily sea surface temperatures from April 20, 2007. In the image, the Gulf Stream starts in the Gulf of Mexico, comes in through the Yucatan Straits, loops around in the Gulf, then comes past Miami, Florida, towards Cape Hatteras, North Carolina. Off Charleston, the current crosses the Charleston Bump where it is deflected seaward and then back towards land, forming "eddy-like" counter-clockwise circulation which which could have trapped the Ben Franklin submersible.
Satellites with sensors that could distinguish temperature differences in ocean surface waters were able to detect Gulf Stream waters turning in a counter-clockwise direction. By itself, this observation offered little explanation for the reasons for formation of the eddy. But in conjunction with bathymetric (measurement of ocean depths) charts, Taylor’s experiment, and Bache’s informed judgment, the satellite images offered oceanographers a compelling means to understand how this piece of ocean bottom affects the behavior of the Gulf Stream.
The northward-flowing Gulf Stream is diverted seaward (eastward) by the initial eastward curvature of the ocean bottom at the Charleston Bump. After it passes the Bump, the current turns back towards the shore. This counter-clockwise rotation of the current produces an eddy-like circulation over the Bump, which could have trapped the Ben Franklin submersible. While the Bump is a relatively small change in the depth on the ocean bottom, the Gulf Stream is also diverted at the New England Seamounts, southeastward of Cape Cod. These interactions of ocean currents with bumps and seamounts are known as “Taylor columns” and are due to the Earth’s rotation. Taylor columns were first discovered by G.I.Taylor during his laboratory experiments.
Richard Legeckis, a new NOAA oceanographer at the time, presented the results of some of the first high-resolution satellite images of the deflection of the Gulf Stream at the Charleston Bump at the annual meeting of the American Geophysical Union in Washington, DC, in 1976. After this meeting, one of the participants, John Bane, shortened the part of the original title of the talk from “…the influence of bottom topography off Charleston, SC…” by re-titling it “The Charleston Bump.” This catchy name, a play on a popular 1920s dance, the Charleston, eventually was used by fisherman and environmentalists along the coast of South Carolina.
Subsequently, many scientific studies at the NOAA Fisheries Facility in Charleston, South Carolina, using satellite images, drifting buoys, and ship observations have revealed that the Charleston Bump increases fish catch downstream, produces intermittent harmful algal blooms along the coast, and moderates the temperatures of coastal waters. Today, complex computer models now assimilate satellite measurements of ocean features to improve weather forecasts and establish fisheries trends.
CoastWatch – An Overhead Ocean Sentinel
Mindful of the satellite observations over a decade earlier that helped solve the mystery of the Ben Franklin submersible entrapment, NOAA created the CoastWatch program in 1987 to make available near real-time satellite images. NOAA did this in response to two events: a bloom of harmful algae (microscopic plants that can be toxic to marine mammals and humans) off the coast of North Carolina and a die-off of more than 700 bottlenose dolphins in the mid-Atlantic. To find the source of the bloom, scientists turned to sea surface temperature data collected by NOAA’s polar orbiting satellites and determined that the Gulf Stream had transported toxic algae cells from Florida into the colder coastal waters of North Carolina.
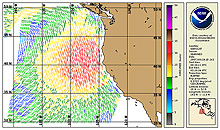
This image from CoastWatch shows West Coast winds on September 20, 2007. Click image for larger view.
CoastWatch products are data and images from NOAA’s geostationary and polar-orbiting satellites, NASA’s Earth observing satellites, the Defense Meteorological Satellite Program, and the Orbview-2 and QuikSCAT satellites. The most commonly requested CoastWatch products are sea surface temperature, ocean surface winds, or ocean color. Sea surface temperature images help meteorologists predict weather and fishermen locate prime fishing areas. Images of ocean color and chlorophyll a (a green pigment that plants use to convert solar energy to another form of energy that they can store) levels help scientists to track changes in the ocean that may indicate harmful algal blooms; sailors and commercial shipping pilots use images of ocean surface winds for navigation. Each image and data set is available in near real-time.
Contributed by Richard Legeckis, NOAA's National Environmental Satellite, Data, and Information Service
Works Consulted
Agassiz, A. (1888). Three Cruises of the United States Coast and Geodetic Survey Steamer "Blake": In the Gulf of Mexico, in the Caribbean Sea, and Along the Atlantic Coast of the United States, from 1877 to 1880. Houghton, Mifflin and Company, Boston and New York. The Riverside Press, Cambridge.
Brooks, D.A. and Bane, J.H., Jr. (1979). Gulf Stream Deflection by a Bottom Feature off Charleston, South Carolina. Science, 201, 29 Sept. 1979, 1225-1226.
From Sea to Shining Sea: A Film Treatment by Paul Gasek and Gene Carl Feldman. (2007). Part of Sea-viewing Wide Field-of-view Sensor (SeaWiFS) Web site. Retrieved August 27, 2007, from: http://seawifs.gsfc.nasa.gov/
FRANKLIN/HTML/FSTSS/FSTSS_intro.html.
Legeckis, R. (1979). Satellite Observations of the Influence of Bottom Topography on the Seaward Deflection of the Gulf Stream off Charleston, South Carolina, J. Physical Oceanography, 9(3), 483-497.
Legeckis, R. & Chang, P.S. (2001). Geostationary Satellite Animation of the Gulf Stream. Island in the Stream: Oceanography and Fisheries of the Charleston Bump, Sedberry, G.R., Editor, American Fisheries Society, Symposium 25, Bethesda, MD. 244 pp.
Legeckis, R., Brown, C.W., & Chang, P.S. (2002). Geostationary satellites reveal motions of ocean surface fronts. J. Marine Systems, Special Issue on Ocean Fronts (Elsevier), I.Belkin, Editor, Vol 37/1-3, 3-15.
NOAA’s CoastWatch Program. (2007). CoastWatch Web site. Retrieved August 27, 2007 from: http://coastwatch.noaa.gov/cw_about_offices.html
Path of the Gulf Stream. (2007) Web site. Retrieved August 28, 2007, from: http://kingfish.coastal.edu/
marine/gulfstream/p2.htm
Sub-Find. Com. (2007). Ben Franklin Submersible – Voyage into Inner Space. Retrieved August 27, 2007, from: http://www.sub-find.com/historical.htm
