The Downs and Ups of Gravity Surveys
The National Geodetic Survey maintains a gravity database covering the U.S. and surrounding areas. This database contains measurements of the acceleration of gravity at over two million locations and is used to compute a model of the geoid, which is needed to determine elevations. Gravity studies are also used to determine deflections of the vertical, for geophysical exploration, for studies of geologic change, for weights and measures laboratories, for making astronomic determinations of latitude and longitude, and even for calculating rocket trajectories.
Even before the U.S. Coast Survey conducted its first, inland elevation survey in 1877, scientists realized that detailed knowledge of Earth’s gravity field was needed to do the calculations of these surveys. The Coast Survey started its first investigation of gravity using pendulums in 1872. This article traces the development of gravity measurements from these first studies to today’s applications.
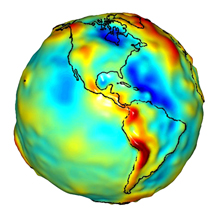
A depiction of the Western Hemisphere geoid. Areas in yellow and orange have a geoid which is comparatively further from the center of the Earth. Click image for larger view and image credit.
Why do we need measurements of the acceleration of gravity? The shape of the Earth is not spherical. The radius at the equator is larger than at the poles due to the long-term effects of the Earth’s rotation. And, at a smaller scale, there is topography—mountains have more mass than a valley and thus the pull of gravity is regionally stronger near mountains. All of these large and small variations to the size, shape, and mass distribution of the Earth cause slight variations in the acceleration of gravity (or the “strength” of gravity’s pull). These variations are measurable by precise instruments, and they manifest themselves by changing the Earth’s liquid environment. Specifically, if one were to remove the tides and currents from the ocean, it would settle onto a smoothly undulating shape (rising where gravity is high, sinking where gravity is low) called “the geoid.” By long-standing scientific convention, the geoid is a surface which defines zero elevation.
Gravity measurements and tide gauges and other quantities are used to determine the geoid. After the geoid is determined, then other surveys, like Global Positioning System (GPS) or differential leveling, can be used to measure surface elevations. Gravity measurements can also be used to determine variations of rock densities (as a geologic mapping tool) and to look for time changes of gravity (for monitoring elevation changes, magma intrusions, or water-table variations), and for metrology laboratories to calibrate weighing machines.
Scientists have measured gravity at locations around the world, establishing “stations” with known gravity values. These known values then become baselines for other relative gravity measurements.
Background: Gravity Measurements
Variations in Gravity
Isaac Newton’s 1687 Law of Gravitation states that the force of gravitation acts directly between any two bodies proportionally to their masses and inversely to the square of the distance between them. The “bodies” could be stars and planets or individual molecules.
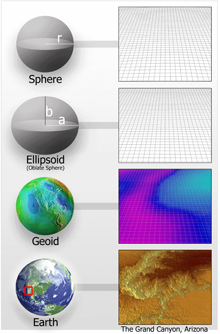
Because the surface of the Earth is irregular and complex, geodesists use simplified mathematical models of the Earth for many applications. The simplest model of the Earth is a sphere. A much more complex model of the Earth is the geoid, used to approximate mean sea level. Even the geoid is a simplified model, however, when compared to actual topographic relief, as shown in this image of four figures of the Earth (Grand Canyon). Click image for larger view.
The Earth is rotating, which generates a centrifugal force (gravity), "throwing" mass out toward space with the greatest force at the equator (where Earth’s rotation moves bodies at the crust with the greatest speed) and least force at the poles (where Earth’s rotation doesn’t move bodies at the crust at all). Additionally, because the Earth is not a perfect sphere but is shaped more like an ellipsoid, the distance to the Earth’s center is greater at the equator than at the poles. The ellipsoidal nature of Earth thus causes variations in gravitational acceleration as a function of an observation point’s latitude. What we call “gravity” is the combination of gravitation (the pull between two masses) and centrifugal force (caused by the spin of the Earth). Gravity is less near the equator than at the poles due to both centrifugal and gravitational issues.
The Moon and Sun also have a measurable effect on gravity. These tidal effects can be calculated from astronomic data and are removed before any analyses. Polar motion, air pressure, and water-table levels also have effects on gravity.
Measuring Gravity
For gravity studies on the Earth’s surface, we use instruments called gravimeters to measure the acceleration of gravity. A gravimeter observing over a dense volume of rock will measure a larger local gravity value (which yields a larger geoid undulation).
Gravity is measured in units of Gals (named in honor of Galileo), where one Gal equals one cm/sec2. Gravity on Earth’s surface ranges from about 983 Gals near the North Pole to near 977 Gals on equatorial mountaintops.
Gravity Value (Gals) |
Approx. Year Developed |
Scientific Usages |
980 |
|
Physics classes, general weights nd measures |
980.6 |
pre-1800 |
|
980.65 |
1870s |
General metrology |
980.654 |
1891 |
Geoid determination, regional geophysical exploration (e.g., Bouguer anomalies) |
980.654,3 |
1938 |
Relative gravimeter base stations |
980.654,32 |
1950s |
Precision geophysical surveys, calibration lines |
980.654,321 |
1979 |
Temporal gravity change studies |
980.654,321,0 (relative only) |
1980 |
Superconducting tidal gravimeters |
This table shows various accuracies of gravity (in terms of significant figures), when the instruments capable of measuring these accuracies were developed, and scientific applications requiring these respective accuracies.
Absolute gravity measurements are now routinely done to nine significant figures (or one part in a billion of Earth’s gravity field). Besides distance and time (or frequency), few physical properties are measured as precisely as gravity.
Early Gravity Measurements
Between 1669 and 1792, various European groups used simple pendulums swung through the air to observe gravity variations in different parts of the world. Gravity is inversely proportional to the square of the pendulum period. The period is the amount of time it takes for the swinging pendulum to return to its starting position.
In 1817, Captain Henry Kater of England designed a convertible compound pendulum, which was swung in air. Kater pendulums were the most commonly used pendulums in the era. These pendulums did not measure gravity in Gals, but only in seconds of pendulum period, which (through knowledge of the pendulum’s length and mass) could be converted to Gals. In the following decades, Kater pendulums were observed around the world, including in some future U.S. territories by the French in 1825. In the 1830s and 1840s, U.S. Navy Lieutenant Charles Wilkes conducted Kater pendulum observations in the U.S., its territories, and Pacific Ocean islands as part of various expeditions.
In 1864, the Swiss developed the Repsold-Bessel Reversible Pendulum. A reversible pendulum was the first instrument which could measure gravity as an acceleration and not just as a period of the pendulum.
Gravity Measurements at the Coast and Geodetic Survey
In 1872, U.S. Coast Survey Superintendent Benjamin Pierce directed his son, Charles Sanders Pierce, to “take charge of the Pendulum Experiments of the Coast Survey and to direct and inspect all parties engaged in such experiments and as often as circumstances will permit, to take the field with a party.”
For the next two decades, Pierce experimented with the Repsold-Bessel Pendulum and Pierce Pendulum of his own design. Observations were made in the eastern U.S., Canada, Hawaiian Islands, Atlantic Ocean islands, Europe, and west coast of Africa. These instruments had four major problems that limited their accuracy: air resistance, changes of pendulum length due to temperature variations, flexure of the wooden supports that held the pendulum, and poor knife edges (fulcrums). In 1887, Major von Sterneck of Austria-Hungary solved these problems by putting a metal pendulum inside a metal chamber from which the air had been evacuated (i.e., a vacuum).
The Mendenhall Pendulum
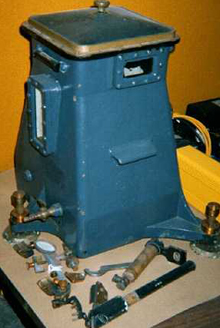
The Mendenhall pendulum was a bronze chamber that could be evacuated of air and maintained at a fairly stable temperature. The pendulums were initially brass, but were replaced by invar for reduced temperature sensitivity. The quartz knife edge was ground to within one micron of a straight line.
In 1890, U.S. Coast and Geodetic Survey (C&GS) Superintendent Thomas C. Mendenhall and others developed an improved apparatus based on von Sterneck’s idea. The result was the Mendenhall pendulum receiver.
Close to 340 domestic stations (including territories) were established using the Mendenhall pendulum, including work in Alaska in 1891 and a trans-continental traverse in 1895. The instrument also traveled to other countries, including Germany, Holland, Java, the Philippine Islands, Cuba, Haiti, the Bahamas, the Dominican Republic, Panama, Canada, and Mexico.
The precision of the Mendenhall pendulum was such that the pendulum period was better determined than that of clocks of the era. Its status as the “world’s best clock” was exploited in the mid-1920s when Major William Bowie authorized this instrument to be used as the clock for A.A. Michelson’s speed of light experiments at Mount Wilson, California. Bowie’s insight that knowledge of the speed of light could be useful for surveying foreshadowed numerous technologies, including the Global Positioning System, laser ranging, Very Long Baseline Interferometry, electronic distance measurement instruments, computers, and absolute gravity meters.
The Brown Pendulum
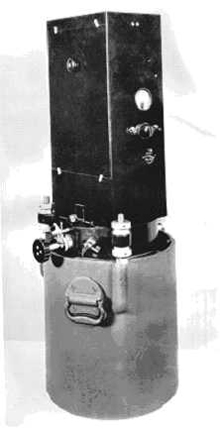
Brown receivers operated in pairs, had less sway than earlier models, and maintained vacuum for entire field seasons.
In 1932, Lieutenant E. J. Brown of the C&GS upgraded Mendenhall’s pendulum apparatus with the receiver that bears his name.
Nearly 900 domestic stations and 400 foreign stations (including a few hundred in Cuba, circa 1934) had been observed before these instruments were retired around 1960. These pendulum stations provided a national backbone of gravity values, which defined the national geoid for decades. Many of these stations continue to serve as reference and calibration stations for spring-based gravimeters.
Continued Instrument Evolution
In 1934, Dr. Lucien J.B. LaCoste of the University of Texas published his seminal paper on the zero-unstressed-length spring gravity meter. The zero-unstressed-length spring concept provides a very compact and very sensitive instrument. This instrument measures gravity as a difference from one station to the next (i.e., a relative measurement). To date, numerous designs of relative gravimeters and about 2,000 instruments have come from LaCoste’s idea. Spring-based gravimeters have become the instrument of choice for more than 98 percent of the world’s gravity observations.
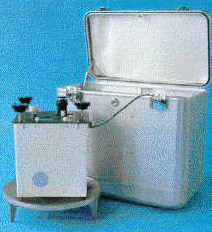
LaCoste and Romberg Model G gravimeters.
In the 1950s, Worden gravimeters were used. And, in the 1960s, C&GS obtained five LaCoste and Romberg model gravimeters that are still in use over four decades later. Relative gravimeter usage has been popular with other federal and local government agencies, universities, and the exploration industry.
NGS Gravity Surveys
Gravity surveys by C&GS and its successor, the National Geodetic Survey (NGS), over the next few decades were many and varied. There were statewide surveys, surveys along level lines, observations for metrological instruments, calibration lines, rocket launch site surveys (e.g., Cape Canaveral), foreign surveys, gravimetric deflection studies, and others.
Between 1976 and 1979, NGS undertook a contiguous U.S. survey to re-observe most International Gravity Standardization Net 1971 (IGSN-71) sites and establish the NGS Gravity Network. In the early 1980s, many surveys were done along level lines corresponding to the North American Vertical Datum of 1988 (NAVD-88).
Absolute Gravimeters
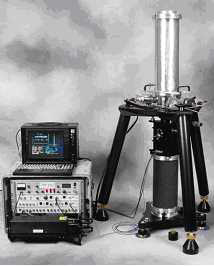
The Axis (Micro-g LaCoste) absolute gravimeter Model FG-5.
In 1986, NGS obtained the JILAg-4 absolute gravimeter, followed by the Axis Instruments (Micro-g LaCoste) FG5-102 absolute gravimeter in 1992. Unlike the pendulum and spring-based relative gravimeters, these meters can measure gravity directly with accuracies of a few microGals.
At this level of accuracy, temporal changes of gravity, such as those due to elevation changes or water-table fluctuations, can be determined. The most notable studies using absolute gravimeters are post-glacial rebound of the Canadian Shield, subsidence (land sinking) near the western Gulf of Mexico coastline, and water-table changes in Arizona.
Through 2005, NGS had observed 274 absolute gravity sites in the U.S. and 104 sites internationally, with most sites having numerous re-observations. NGS has also established a few high-order calibration ranges for relative gravimeters and runs a continuously-operating, cryogenic gravimeter in Longmont, Colorado, to measure tidal effects and long-term gravity change. In recent years, NGS has flown spring-based gravimeters in near offshore areas to link land and sea observations.
Conclusion
Since the 1870s, the U.S. Coast Survey and its successors have been at the forefront of measuring the acceleration of gravity in the U.S. and around the world. Today, NGS cooperates with numerous governmental, academic, and commercial institutions to maintain international gravity databases. NGS has used these data to generate sequentially improved models of the geoid, which, when used with other surveying data, are necessary to define elevations. The data are also used by the geophysical community for geological exploration.
Contributed by Daniel Winester, NOAA’s National Ocean Service
Works Consulted
Duerksen, J.A. (1949). Pendulum gravity data in the United States. U.S. Coast and Geodetic Survey Special Publication No. 244, 218 p.LaCoste, L. (1988). The Zero-length Spring Gravity Meter. Geophysics: The Leading Edge of Exploration, Vol. 7(6), pp 20-24.
Lenzen, V.F. & Multhauf, R.P. (1965). Development of Gravity Pendulums in the 19th Century. U.S. National Museum Bulletin 40, paper 44, pp301-348.
Mendenhall, T.C. (1892). Determinations of Gravity with the New Half-second Pendulums. Report of the Superintendent of the US C&GS for the Fiscal Year Ending June 30,1891, Part II, Appendix 15, pp 503-564.
Michelsen, A.A. (1927). Measurement of the Velocity of Light Between Mount Wilson and Mount San Antonio. Astrophysical Journal, Vol. LXV (1), pp 1-14.
Moose, R.E. (1986). The National Geodetic Survey Gravity Network. NOAA Technical Report NOS 121 NGS 39, 32 p.
Morelli, C., et al. (1971). The International Gravity Standardization Net 1971. IAGS IAG Publication Speciale No. 4, 194 p.
Peter, G., Moose, R.E., & Wessells, C.W. (1989). The National Geodetic Survey Absolute Gravity Program. NOAA Technical Report NOS 130 NGS 43, 17 p.
Swick, C.H. (1942) Pendulum Gravity Measurements and Isostatic Reductions. U.S. Coast and Geodetic Survey Special Publication No. 232, 81 p.
