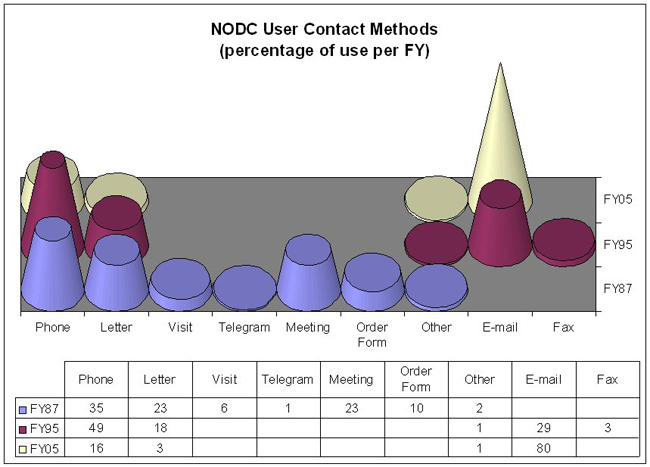
This graph shows percentages of the methods used to contact the NODC in fiscal years (FY) 1987, 1995, and 2005. As the graph shows, the most common method for contacting the NODC in 1985 was via phone, versus 2005 when 80 percent of requests are submitted via Email.