The Story of the Tide Observer
NOAA has been monitoring sea level variations for many years. Some U.S. locations have sea level records dating back more than 100 years. The nation uses water level data for a variety of practical purposes, including nautical charting, maritime navigation, and tsunami and storm surge warnings. Mariners use the information to time their approaches to and exit from ports. Long-term tide records are used for marine boundary determinations, tidal predictions, monitoring sea level trends, oceanographic research, and climate research. Bridge, breakwater and deep-water channel construction also are affected by tidal and current changes.

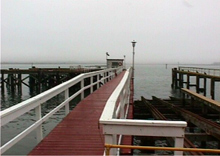
A typical tide house or shelter on a long pier.
Before computers were able to regulate tide gauges and send data directly to NOAA headquarters via satellite radio, tide observers were needed to maintain gauges, adjust timers, and collect and send data for processing. The story that follows tells the tale of one such tide observer, on a bleak winter morning.
Every Monday through Friday, at approximately 9:00 a.m., he walked out to the NOAA tide station to check the tide gauge equipment. By making an observation at the same time each day, a measurement check could be made throughout almost every stage of the tide by the end of the month, because a tidal day is about a half-hour longer than a solar day.
On this particular morning, 50-knot winds had been blowing from the north all night and remained steady as the tide observer neared the pier. The north shoreline of the peninsula faced due north and there was nothing to shelter him from the 20-mile wind fetch. The coastal storm had moved through quickly the previous night, leaving a layer of mixed snow and freezing rain on every surface.
Getting Ready
The tide observer first called to get the official time and, based on this time, adjusted his watch. Today, he also took the extra step of encasing the paper data recording forms and clipboard in a plastic bag, to keep them from getting wet. Even though the tide station was an enclosed wooden structure that housed the tide gauges, it was no match for the driving rains encountered on the end of the pier.
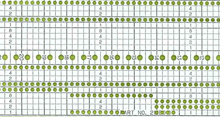
The primary gauge was an analog-to-digital recorder (ADR) that recorded binary (computer compatible) water-level elevation data on a foil-backed paper punch tape. A battery-driven, solid-state timer was used to move the paper tape forward and to drive the line of mechanical punches through the tape every six minutes.

The analog-to-digital (ADR) punched paper tape used to record water level elevations every six minutes. Click image for larger view.
In his backpack, the tide observer took an extra roll of foil tape, a screwdriver, scissors, pens and pencils, and, for the backup gauge, an extra supply of ink and a roll of strip chart. The backup gauge used a spring-wound, clock-driven, analog strip-chart recorder that made a continuous ink pen trace of the rise and fall of the tide.
He checked the remote readout on the wall from the anemometer, an instrument that measures wind speed. It still read 50 knots from the north. After putting on his knee-high boots, heavy coat, gloves, wool hat, backpack, and goggles, he left for the 300-yard walk to the pier.
Braving the Elements
Leaning into the wind and moving along the edge of the road where there was a bit of traction, he was able to slowly make progress. He could see that the wind was overtopping the sea swell and driving sea spray off the white caps themselves. Even though the waves were not close to coming over the wooden pier, they slammed against the end of the pier, causing sea spray to fly up and land on the frozen surface.
Arriving at the entrance to the pier, there was still a 150-yard walk to the tide house located at the far corner. The eight-foot high, four-foot by four-foot white-sheathed house was the only structure on the pier. By leaning into the wind, and crawling a bit when the gusts came up, he finally reached an area in which the tide house provided a wind shadow where he was able to relax a bit.
The Tide House
Every surface was coated in frozen sea spray, but he was able to unlock the tide house door and squeeze inside. The entire inside of the house was damp and standing in the enclosure was disorienting because the tide house rocked with every wave that hit the pier.
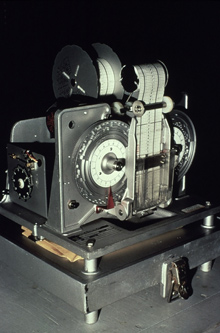
Quickly checking the gauges, it appeared everything was working properly and on time. ADR gauges have a float hung from a wire that travels up and down with the tide inside a 12-inch stilling well. The stilling well has a one-inch opening at the bottom which "stills" or damps the wave action on the outside. Even so, the waves were large enough to cause considerable motion inside the stilling well and the float wheel was moving rapidly back and forth. On a few previous occasions, the wave action was strong enough to knock the float wire off the take-up spool, causing a kink in the wire.

The analog-to-digital recorder (ADR) tide gauge used by NOAA from the mid-1960s to the mid-1990s. Click image for larger view.
The backup tide gauge and strip chart recorder were producing a half-inch wide ink swath on the strip chart as the pen stylus rose and fell with the wave action and the paper advanced with time. The sensor used for the backup gauge was a "bubbler" pressure sensor, which used pressurized nitrogen gas to measure water levels. The nitrogen was emitted via a hollow tube connecting the storage tank and a submerged orifice, creating a series of bubbles which were released at a fixed interval. The water pressure caused by the depth of the water would change as the tide changed, allowing water level to be measured. The nitrogen tank gauges indicated that plenty of gas was left.
Manual Measurements
Forcing the tide house door open, he crawled against the wind to the other side of the pier where a tide staff was located. Tide observers made independent checks of the tide gauge elevations by reading water elevations on a graduated tide staff. The tide staffs were part of the system to connect gauge readings to the land, since the tide staffs were surveyed in or leveled to bench marks located around the laboratory facility once each year. In this way, tidal datum elevations relative to the land could be determined.

A typical tide staff graduated in tenths of feet and read daily by tide observers. Click image for larger view.
Tide observers were trained to look at an average of high and low staff readings as wave crests and troughs passed. Today the average height of the waves seemed to be near five to six feet, so the tide observer waited as several waves passed by, mentally noting the average high and low readings.
The next task was to take a sea surface temperature and density measurement. Using a line, he lowered a brass bucket thermometer into the water next to the staff, raised and lowered it a few times to wash it out, left it in the surface waters below the wave action for a few moments to get a good reading, and brought it back up to the surface.
Struggling against in the wind, he took the bucket water sample back into the tide house. He noted the time of the staff reading and drew a line across the punched paper tape at the time of the reading and drew an arrow on the backup gauge strip chart. He wrote down the date, time, and the high/low staff readings, noting the wind conditions and the sea state. After the end of each month, he accumulated the monthly data sheets, took off the previous month's ADR and bubbler punched paper tapes and strip charts, and mailed everything to NOAA headquarters.
After reading and recording the water temperature, he emptied a sample of the water into a clear plastic container, inserted another thermometer into the sample, recorded the temperature, and then inserted a scaled hydrometer to record a water density reading. The hydrometers were fragile glass vials, weighted at the bottom with a paper scale inserted into the thin upper end.
Daily temperature and density readings recorded by tide observers around the U.S. formed the basis for a systematic national observing system for sea surface temperature and density.
The Journey Back
After making sure the tide gauge covers were securely fastened, the tide observer opened the door and braced himself once again for the force of the winds. Instead of being wary of the winds this time, he knew that they would be at his back. He slowly spread his feet, caught his balance, stretched out his arms to help make his coat act like a sail, and let the wind slide him back along the pier all the way to shore. Along the way, he kept on thinking of how great it was to be a tide observer.
Contributed by Stephen Gill, NOAA's National Ocean Service (and former tide observer)
