
Science All Around: NOAA's Science on a Sphere
As a federal agency, NOAA works to ensure that the public is aware of and understands the weather and water information and services that the organization provides. Outreach and education to increase environmental literacy are key steps towards conserving Earth's environment. As such, NOAA continually strives to develop new means to capture the imagination of the public and to help everyone to explore our world. NOAA's Science On a Sphere® is one such mechanism.
- Introduction
- The Birth of Science On a Sphere
- The Evolution of the Sphere
- How the Sphere Works
- Conclusion
- Works Consulted

This schematic shows the typical layout for a Science On a Sphere® display. Click image for larger view.
Imagine gazing upon Earth as you are suspended in orbit 22,000 miles above its surface. You watch as a hurricane forms, slowly gathering strength, it travels westward from Africa, across the Atlantic Ocean, and towards the Gulf of Mexico. The prevailing westerly winds and the easterly trade winds materialize before your eyes. You can see the dry, brown deserts of Australia, Asia, and Africa in contrast to the adjacent verdant plains and forests. You can trace Earth’s continuous plates from ocean depths to mountain chains. Our dynamic planet transforms before your eyes with the help of environmental data projected onto a movie-screen-like, white sphere.
Called “Science On a Sphere®,” this spectacular vision of our Earth is the brainchild of Alexander (Sandy) MacDonald, Director of NOAA’s Global Systems Division in Boulder, Colorado.
Many things scientific are worked out on napkins or envelope backs; NOAA’s Science On a Sphere® owes its start to a beach ball. While this innovation may have had a low-tech beginning, it uses state of the art technology to educate, inform, and excite those who see it.
A Humble Beginning: The Birth of Science On a Sphere®
Until recently, scientific data were presented in two dimensions—on paper, a view graph, or computer screen. An image of the Earth can fit on a two-dimensional map, but not without some distortion. Some improvements to present data in three dimensions have helped students and scholars to better understand the information; however, even these improvements had limitations.
In 2002, NOAA unveiled a way to see information the way that nature presents it – on a sphere. Scribbles on napkins and a beach ball were the humble beginnings of this exciting scientific advancement.
“I started thinking about this several years ago and did some experiments on the deck of my house using a beach ball,” said Sandy MacDonald, inventor of the Sphere. “I knew that putting NOAA climate, weather, oceanic, and geophysical information on a sphere would be a spectacular tool for explaining NOAA’s science to a variety of audiences.”
NOAA has an extraordinarily important scientific story to tell. Public actions are often guided by NOAA science and operations – everything from tornado warnings to predictions about the fate of the planet as greenhouse gases increase are derived frm NOAA data. NOAA must not only deliver the best scientific answers possible, but also must ensure that the public, policy makers, and our children understand its discoveries.
The Evolution of the Sphere
The Science On a Sphere® project was created to present NOAA’s global science and operations to the public in a new and exciting way. The first phase system, consisting of a 68-inch (1.7-meter), 230-pound (104-kilogram), white fiberglass sphere; high-speed computers; and multiple projectors, was developed in 2001 by NOAA’s Forecast Systems Laboratory (now the Global Systems Division).
Some of the first images displayed on the Sphere were the Earth’s topography and bathymetry, lights of the Earth at night, infrared satellite imagery showing clouds in motion, and X-ray images of the Sun with solar storms raging across the face of the sphere.

Students working on a lesson plan related to Science on a Sphere® at Broomfield Heights Middle School. Click image for larger view and full caption.
By autumn of 2002, Science On a Sphere® had matured sufficiently for a classroom demonstration. In October, Beverly Meier, educational consultant and eighth-grade teacher at Broomfield Heights Middle School in Colorado, arranged for more than 500 students to view Science On a Sphere®. She also developed several lesson plans to accompany the Science On a Sphere® demonstration that focused on the Earth’s geographic features, latitudes and longitudes, atmospheric water vapor, cloud motion in the Earth’s atmosphere, and the limitations of maps which depict three-dimensional data on a flat surface.
The students were wide-eyed and enthusiastic about the displays. In the end, it was obvious that the first use of Science On a Sphere® as an education tool was a great success.
How the Sphere Works
The Science On a Sphere® system uses four video projectors to display images on a smooth, white fiberglass sphere. Each projector is driven by a computer. A fifth computer is used to control the operation of the display computers. The computers communicate with each other via a network. Each computer is a relatively powerful PC, with dual Pentium processors and high-end graphics cards.

The typical floor plan or layout for a Science On a Sphere® system. Click image for larger view.
The magic of Science On a Sphere® comes largely from the software that processes data so that it can be displayed on the globe. Written by NOAA scientists, this software takes information from several sources and creates data slices that are then recombined for display on the sphere. To create the seamless illusion of a planet in motion, synchronization of these slices has to be kept at the sub-millisecond level (i.e., very, very small!)
The software can convert nearly any data for use. Datasets are currently available that project everything from nighttime lights on the Earth’s surface, to temperature changes associated with rising atmospheric carbon dioxide, sea surface temperatures, shifts in the Earth’s tectonic plates over time, and weather predictions.
Conclusion
Today, after five years of development, the new carbon-fiber reinforced sphere weighs 46 pounds, down from 230; five very fast computers run the system, down from the original 10; the four video projectors produce four times the resolution and almost four times the brightness of the original; and the system has become much less costly to purchase.
Science On a Sphere® is making appearances at meetings and conferences across the country and it is now permanently installed at multiple museums and science centers, mesmerizing audiences and helping to increase public awareness of the environment and the science behind NOAA’s products and services.
As NOAA celebrates 200 years of science, service, and stewardship, innovative technologies such as Science On a Sphere® will help the public to understand the science borne from the legacy of an agency created two centuries ago.
According to creator Sandy MacDonald, Science On a Sphere® is “a unique way to explain complex information using images. It can be used to illustrate geography, weather, climate, space weather, and a host of other kinds of data. It’s limited only by our imagination.”
Contributed by Jana Goldman and Rhonda Lange, NOAA’s Office of Oceanic and Atmospheric Research
Works Consulted
Earth System Research Laboratory. (2005). Science On a Sphere Web site. Retrieved July 19, 2006, from http://sos.noaa.gov/.
Fullerton, N. (2003). NOAA Science on a Sphere®: A New Educational Tool. Retrieved July 19, 2006, from http://www.fsl.noaa.gov/publications/forum/feb2003/2_03_SOS.html.
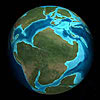 Plate Tectonics and Paleo Animation
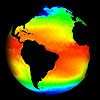
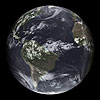 Real-time Infrared Satellite over Land Animation
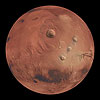 Mars — The
Red Planet Animation
Mars — The
Red Planet Animation