The Tropical Atmosphere Ocean Array: Gathering Data to Predict El Niño
- Buoys Around One-third the Globe!
- Effects of El Niño
- Normal Versus El Niño
- Building and Deploying the Array
- Maintaining the Array
- A New Standard
- Many Plaudits
An Array of Buoys Wrapping Around One-third the Circumference of the Globe!

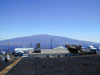
The ATLAS moored buoy was breakthrough technology and a radical departure from existing ideas of how to build an observing system to forecast El Niño. These buoys transmit oceanographic and meteorological data to shore in real-time via the Argos satellite system.
The Tropical Atmosphere Ocean (TAO) array is a network of deep-ocean buoys at 67 sites in the equatorial Pacific Ocean that collect ocean and atmospheric data to predict the global climate phenomenon known as El Niño-Southern Oscillation (ENSO). This remarkable system transmits data via satellite to weather and forecasting centers around the world in real-time and to research scientists via the World Wide Web within one day. The array measures winds, sea surface temperature, relative humidity, air temperature, ocean currents and subsurface temperature at ten depths in the upper 500 m (1,640 ft) of water. The data gathered by the array are the underpinnings of ENSO forecasting for NOAA’s National Centers for Environmental Prediction and the European Center for Medium Range Forecasting.
The 1982-1983 El Niño event, the strongest of the century up to that time, spurred climatologists and meteorologists to establish the TAO array. Unpredicted and undetected until this episode was near its peak, the world needed a way to better monitor, understand, and predict El Niño. But what makes El Niño so significant to deploy a set of buoys, anchored at depths from 1,500 to 6,000 meters (0.9 to 3.7 miles) and stretching one-third the circumference of the globe?
Effects of El Niño
El Niño causes dramatic shifts in weather around the world that have potentially significant agricultural, economic and public safety consequences. Among them are increased rainfall across the southern tier of the U.S. and in Peru, which has caused destructive flooding, and drought in Indonesia and Australia, sometimes associated with devastating brush fires. At higher latitudes in the Northern Hemisphere, the impacts are most evident in wintertime. In the continental U.S., temperatures in the winter are warmer than normal in the north central states and cooler than normal in the southeast and the southwest. El Niño also impacts Pacific marine ecosystems including commercial fisheries.
The Tropical Atmosphere Ocean array helps to forecast El Niño-Southern Oscillation and its impacts. Armed with advance warnings of the 1997-98 El Niño for example, California alone estimated saving $1 billion as a result of preparedness measures taken by individuals, businesses, and government officials.
Normal Versus El Niño Climatic Conditions

During normal climatic conditions (top), trade winds pile warm surface waters (red) in the western Pacific. During El Niño conditions (bottom), trade winds ease in the central and western Pacific causing a shift eastward in warmer ocean water, bringing more precipitation along with it. Click image for larger view.
Under normal climate conditions, when neither El Niño conditions nor opposite conditions known as La Niña, exist, trade winds blow westward across the tropical Pacific. These winds pile up warm surface water in the western Pacific, so that the sea surface is about 1/2 meter (about 20 inches) higher and 8 degrees Celsius (14.4 degrees Fahrenheit) warmer than off the coast of South America in the eastern Pacific, due to an upwelling of nutrient-rich cold water. Abundant rain falls in the western Pacific, while the eastern Pacific is relatively dry.
During El Niño, the trade winds relax in the central and western Pacific, reducing the upwelling and causing the sea surface temperature to rise off South America. Rainfall follows the warm water eastward. The eastward shift of heated ocean water results in large changes in global atmospheric circulation, which in turn forces weather changes in regions far removed from the tropical Pacific. El Niño and La Niña are opposite phases of ENSO 1. Neither should be confused with “normal” climatic conditions.
Building and Deploying the Array

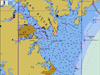
The array of 67 moored buoys that monitor ocean and atmopheric conditions in the equatorial Pacific span approximately one-third the circumference of the globe. Click image for larger view.
When the 1982-1983 El Nino caught nations off guard and exposed the inadequacy of the existing climate observation system, NOAA set to work to develop the TAO array under the direction of Stan Hayes. NOAA based the array concept on the Autonomous Temperature Line Acquisition System (ATLAS) developed by its Pacific Marine Environmental Laboratory. This was breakthrough technology and a radical departure from existing ideas of how to build an ENSO observing system. NOAA field tested prototype ATLAS units in early 1984 and deployed a modest scale array along longitude 110W later that year.
Beginning in 1985, NOAA deployed additional ATLAS units at the start of the 10-year (1985-1994) international Tropical Ocean Global Atmosphere (TOGA) program. The array grew slowly during the first half of TOGA as scientists evaluated the proof of concept for a sustained buoy observing system. Initial successes led to a rapid expansion of the array during the second half of TOGA with the widespread support of the climate community. Implementing the array was a research undertaking of unprecedented organizational effort, fieldwork, and scientific applications.
Maintaining the Array

Scientists off NOAA Ship Ka'imimoana adjusting sensors on TAO buoy. Click image for larger view.
NOAA continued to operate the TAO array after the end of the TOGA program as a contribution to the Global Ocean Observing System and the Global Climate Observing System. To sustain the array, NOAA acquired a surplus U.S. Navy vessel in late 1993 and rechristened it as the NOAA ship Ka’imimoana in May 1996 to service the buoys. In 2000, TAO became TAO/TRITON to recognize the addition of TRITON (Triangle Trans-Ocean Buoy Network) mooring buoys in the far western reaches of the array by the Japan Agency for Marine-Earth Science and Technology.
A New Standard for Access to Oceanographic Data
The Tropical Atmospheric Ocean array set a new standard for free and open access to oceanographic data for scientific research by making atmospheric and oceanographic data available in real-time or within a day of observation. This represented a radical break from oceanographic tradition in which principal investigators withhold new observations from circulation for many months to years while they analyzed their data for publication. Thus, TAO greatly accelerated community-wide advances in ENSO research. All subsequent sustained ocean observing system initiatives have adopted the TAO standard for data access.
Many Plaudits

NOAA began developing the next generation ATLAS mooring (shown here) in 1994 and deployed the first one in 1996. Between 1984 and 2001 NOAA deployed over 500 first generation moorings with a of one-year design lifetime. Click image for larger view.
The array’s success has attracted many plaudits. Science News lauded TAO in its December 7, 2002 edition when it said, “Scientists generally agree that ocean observatories' shining accomplishment has been the prediction of El Niños…[enabled by] the network of buoys known as the Tropical Atmosphere Ocean array…” Fully in place to predict the 1997-98 El Niño, the strongest of the century, the secretary general of the World Meteorological Organization declared that, “…the array of moored buoys established for TOGA… has been an invaluable source of data for monitoring and modeling the event…” NOAA's Climate Prediction Center attributed its success in forecasting the 2002/03 El Niño to “. . . a combination of more experience watching El Niños develop, two decades of research, and the observation network that NOAA....invested in” (Science, 26 July 2002).
Completed only since 1994, the TAO array has already established itself as vital and indispensable to weather and climate forecasters in the U.S. and around the world. It provides a fundamental data set that will continue to serve as the observational cornerstone of ENSO research and operational forecasting.
1. The Southern Oscillation refers to an interannual fluctuation in tropical sea level pressure between the eastern and western hemispheres. During El Niño, unusually high atmospheric sea level pressures develop in the western tropical Pacific and Indian Ocean regions, and unusually low sea level pressures develop in the southeastern tropical Pacific.