Foundation Data Sets and Products

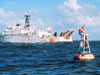
Sixty-seven of these ATLAS buoys, moored across the tropical Pacific, transmit oceanographic and meteorological data to shore in real-time via the Argos satellite system. Together they produce a foundation NOAA data set that enables forecasters to predict the global climate phenomenon known as El Niño.
Nautical Charts…Tide Predictions…Weather Forecasts and Warnings…Flood Forecasts and Warnings…Search and Rescue Satellite-aided Tracking (SARSAT)…Global Positioning…Tsunami Warnings…U.S. Drought Monitor…Climate Prediction…Harmful Algal Bloom Bulletins…
National Spatial Reference System…Significant Event Satellite Imagery…Fishery Stock Assessments…The Fishery Bulletin…National Water Level Observation Network…Coastwatch…World Ocean Database…Menhaden Biostatistical Data Set…Northeast Fisheries Bottom Trawl Survey Time Series Data Set…NOAA Weather Radio-All Hazards…Computer-aided Management of Emergency Operations (oil spill model)…Climate Models…Mauna Loa Carbon Dioxide Record…Mussel Watch…Tropical Atmosphere Ocean Array…..Environmental Sensitivity Index Maps…Space Environment Forecasts… The list of NOAA data sets and products goes on and on!

Deploying bongo nets for the California Cooperative Oceanic Fisheries Investigations (CalCOFI). The CalCOFI data set represents the longest (1949-present) and most complete (more than 50,000 sampling stations) time series of oceanographic and larval fish data in the world.
We in the NOAA family take enormous pride in the array of products and services that we offer our fellow Americans and all peoples around the globe. Creating them requires huge amounts of underlying data. Without these data, products and services like weather forecasts and warnings, nautical charts, the National Spatial Reference System, fisheries management, harmful algal bloom warnings, climate outlook, and a host of others would be impossible. Some of the data sets and products that we develop and maintain are so fundamental that they define us as an organization.
Those that we honor here as the NOAA Top Ten in 2007, our 200th anniversary year, epitomize the meaning of the term ‘foundation.’ They are pillars of longevity, backbones of Earth science infrastructure, the bedrock of weather forecasts and warnings, underpinnings of fishery science, and keystones to solving the most challenging climate questions of our time. The National Spatial Reference System, Nautical Charts, Weather Observations, and The Fish Collection reach back to the 19th century. The Fish Collection, Mauna Loa Carbon Dioxide Record, Tropical Ocean Atmosphere Array, and World Ocean Database are global in scope and significance. NOAA’s Coast Survey intertwines information from a staggering 14,000 shoreline maps, 160 years of tide observations, 11,500 hydrographic surveys, 76 million depth soundings, and more than one million geodetic positions to maintain its suite of more than 1,100 nautical charts!

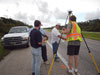
Today more than 11,000 volunteers nationwide take daily weather observations that are the foundation of numerous products of NOAA’s National Weather Service such as snow depth maps, long-term drought index, and crop moisture index.
These Top Ten Products and Data Sets are models of steadfastness and commitment. They reflect the same qualities in NOAA, and we are honored to be part of an organization that holds these values. So now we invite the entire NOAA family, the American public, and people from around the world to learn more about some of our most important and most enduring work:
- The Fish Collection (1856–present): is of great historical value as a window to early expeditions and voyages of discovery. It is also taxonomically significant, containing about 20,000 of the 28,000 species of fishes worldwide.
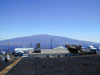
- Mauna Loa Carbon Dioxide Record (1958–present): is the longest continuous record of atmospheric concentrations of carbon dioxide, the chief greenhouse gas responsible for global climate warming. It is often called the most important geophysical record on Earth.
- Mussel Watch (1960s–present): is the longest continuous contaminant monitoring program in U.S. coastal waters. Its data set includes contaminant concentrations in sediments, oysters, and mussels monitored at 300 sites around the country for over 100 organic and inorganic pollutants.
- National Spatial Reference System (1816–present): is the complete set of survey marks or reference points that surveyors use as starting points to ensure accurate and consistent surveys across the nation.
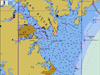
- Nautical Charts (data collection: 1816–present; chart production: 1844-present): is a suite of over 1,100 charts that depict coastlines, islands, rivers, harbors, and features of navigational interest such as water depth, hazards, and aids to navigation. Charts are constructed by combining information from shoreline mapping, tide observations, depth soundings, and geodetic positioning.
- NOAA Weather Radio (1950s–present): is the primary and official source of weather data, forecasts, and life-threatening weather warnings for the United States.
- Regional Fisheries Data Sets (California Cooperative Oceanic Fisheries Investigations, 1949–present; Biostatistical Menhaden Surveys, 1952–present; Northeast Bottom Trawl Surveys, 1963–present): are the backbone of NOAA Fisheries scientific research and conservation decisions.
- Tropical Atmosphere Ocean Array (1985–present): is a network of deep-ocean buoys at 67 sites in the equatorial Pacific Ocean that collect ocean and atmospheric data to predict the global climate phenomenon known as El Niño.
- Weather Observations (1890–present): are daily reports on air temperature, precipitation, and other weather factors such as snow depth, river levels, and soil temperature from volunteers around the nation in NOAA’s Cooperative Observer Network.
- World Ocean Database (1961–present): is the world’s largest collection of vertical profile data of ocean characteristics available internationally without restriction. It contains data for 28 ocean variables in 11 distinct data sets.
And now for our honorable mentions...