
Raster Charts
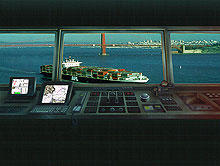
Raster Chart Display System on the bridge of a ship. Click image for larger view.
Throughout the 1990s, advancements in technology transformed the appearance, use, and functionality of nautical charts, fueling dramatic improvements in navigational safety. A first step in the transformation from paper to electronic charts was creating digital raster charts.
In 1994, NOAA's Office of Coast Survey digitally scanned its entire suite of 1,000 paper charts. These digital charts are called "raster charts." Commercial companies created software that allowed mariners, using standard computers aboard ships, to display real-time global positioning system (GPS) vessel positions over an image of a chart. These systems, called Raster Chart Display Systems (RCDS), immediately proved to be a valuable new navigational tool: one glance at the raster chart display and a mariner could immediately determine vessel position relative to important geographic features. This eliminated the time-consuming process needed to establish a fix using a paper chart.
In addition to creating a new tool for mariners, the creation of a suite of raster charts also made NOAA's cartographic chartmaking more efficient. Charts could now be updated in a timely manner using Computer Aided Design (CAD) software in lieu of the manual techniques of the past. Chart updates that once took months to deliver to the mariner could now be made available electronically through a weekly update service operated by NOAA and its private partner, Maptech.
Raster charts are still used by mariners today. Thanks to the development of raster chart technology, mariners can download raster charts and updates for free over the Internet. In addition, the same technology used to create raster charts fuels "Print on Demand" paper charts, providing up-to-date charts that can be immediately printed following purchase.
While raster charts advanced maritime navigation in the 1990s, they did not address all of the limitations associated with paper nautical charts. A raster chart is a direct copy of an existing paper nautical chart—the chart is stored as one whole image and a computer displaying a raster chart recognizes only this one image. The computer is unable to differentiate between the items, such as a buoy and a shipwreck, or to recognize if a charted water depth is too shallow to clear a vessel. Because of the inability to distinguish information on a chart, raster systems are said to have no inherent "intelligence."This lack of intelligence means that raster charts have a minimal ability to provide danger warnings to the mariner.
Works Consulted
Arkenau, L., Black D., & Legeer, S. (2004). NOAA's digital update service, Print-On-Demand, and critical chart correction Web site. Retrieved May 12, 2006, from: http://www.thsoa.org/hy01/13_1.pdf.
Exxon Valdez Oil Spill Trustee Council. (2006). Exxon Valdez Oil Spill Trustee Council Web Page. Retrieved online April, 2006, from: http://www.evostc.state.ak.us/index.htm.
Kelly, J. (2001). Prince William Sound: Paradise Lost? Retrieved online April, 2006, from: http://library.thinkquest.org/10867/home.shtml.
Related Websites
NOAA Office of Coast Survey
Download
NOAA Raster Navigational Charts
Download
NOAA Electronic Navigational Charts