The Evolution of Remotely Sensed Data Used by the National Ice Center
Prior to the 1970s, the majority of ice analysis and monitoring was performed almost exclusively by visual observation from aerial reconnaissance missions and/or ship reports. Today, however, visual observation has been largely replaced by remote sensing. Remotely sensed data comes in many forms that are used at the National Ice Center (NIC). Visible and infrared data, along with passive microwave imagery, have been used by analysts for several decades. During the 1990s, Synthetic Aperture Radar (SAR) and QuikSCAT scatterometer data were added to the list of data sources employed in NIC operations. Today, each of these data sources continue to play a role in NIC ice analysis.
Visible/Infrared Imagery

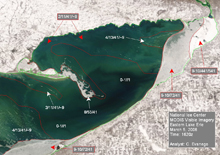
Example of a "true color" visible MODIS image showing ice in eastern Lake Erie in March of 2006. Click image for larger view.
During the 1970s, visible and infrared imagery from Earth-observing satellites began to play a role in monitoring global ice conditions. Through the 1980s, the resolution and availability of these data continued to improve. During the 1980s, NOAA's Advanced Very High Resolution Radiometer (AVHRR) and the Defense Meteorological Satellite Program's (DMSP) Operational Linescan System (OLS) formed the backbone of the remotely sensed data incorporated into NIC ice analyses. With spatial resolution of 1.1 kilometers and 0.55 kilometers, respectively, AVHRR and OLS provided excellent data for global-scale ice observation and analysis. These two programs continue to provide remotely sensed data to the NIC to this day.
Additionally, the new millennium saw the launch of NASA's Moderate Resolution Imaging Spectroradiometer (MODIS), which gives ice analysts an additional data source. Available in a spatial resolution of up to 250 meters, MODIS is the highest resolution visible imagery available to NIC analysts.
Passive Microwave Imagery
Since the early 1980s, the NIC has incorporated passive microwave imagery. During that era, the NIC used Electrically Scanning Microwave Radiometer (ESMR) data that arrived in 6 × 3 inch film strips; these data covered a vast area of the polar regions. The fact that so much data were packed into such small strips of film made the data especially difficult to analyze.
Since the late 1980s, the NIC has used DMSP's Special Sensor Microwave Imagery (SSM/I). Although it has a relatively low spatial resolution at 25 kilometers, the global coverage provided by SSM/I is advantageous for ice analysis. Since 1993, the NIC has received and analyzed SSM/I imagery digitally.
Scatterometer
Although more often associated with monitoring offshore winds, scatterometer data has also proven useful for monitoring ice conditions. NIC analysts recently began using scatterometer data made available from NASA's QuikSCAT system. QuikSCAT's daily global coverage is a valuable addition to the pool of sensors from which NIC analysts can choose.
Synthetic Aperture Radar
Synthetic Aperture Radar (SAR) imagery for ice analysis began in the early 1990s. The first SAR imagery employed by NIC analysts was from the European Space Agency's ERS-1; this became available to the NIC in March 1992. The primary advantage of SAR imagery, in addition to its high spatial resolution, is its ability to "see" through clouds. Unlike visible and infrared imagers, SAR is an active sensor that allows penetration of cloud cover to the surface below.

Graphic showing the RADARSAT-1 satellite, with its components labeled. Click image for larger view and image credit.
With this new remotely sensed data now available, there was a learning curve for analyst interpretation. According to David Benner, former Deputy Director of the NIC, the arrival of SAR imagery at the NIC necessitated "a real training ramp-up." Accustomed to analyzing visible and infrared images of the Earth's surface, ice analysts now had to learn how to analyze images of backscatter.
The launch of RADARSAT, an Earth-observation satellite developed by Canada, in 1995 was a turning point in global- and regional-scale ice analysis. Today, NIC analysts make extensive use of SAR imagery from RADARSAT.

Graphic showing the various beam modes available with RADARSAT-1. Click image for larger view and image credit.
With a post-processing spatial resolution of 100 meters and all-weather capabilities, imagery from the ScanSAR Wide mode of RADARSAT has proven invaluable to the NIC. In 2006, the RADARSAT system was still going strong, and NIC analysts are anticipating the launch of RADARSAT-2, currently scheduled for 2007.
