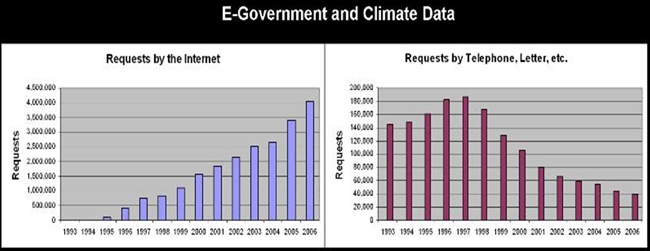
These graphs illustrate the transition of climate data access toward e-Government. User requests via the Internet continue to increase as manual requests decrease.
High resolution available. (155KB, 1066x412).
With the NOAA 200th Celebration coming to a close at the end of 2007, maintenance of this Web site ceased. Updates to the site are no longer being made.

These graphs illustrate the transition of climate data access toward e-Government. User requests via the Internet continue to increase as manual requests decrease.
High resolution available. (155KB, 1066x412).