
 New York Bay and Harbor and the Environs
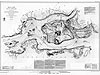 Hell Gate and Its Approaches
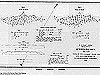 Pot Rock and Way's Reef, Hell Gate
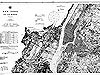 New York Bay and Harbor
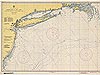 Approaches to New York
 New York Harbor, Upper Bay and Narrows
 Harlem River Nautical
 New York Harbor Nautical
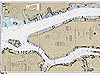 Hudson and East Rivers
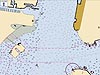 New York City Electronic Navigational Chart
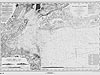
New York Bay and Harbor
This nautical chart depicts New York City in 1910, at the end of a decade of record population growth. Between 1900 and 1910, the city's population grew from 3,437,000 to 4,767,000-the highest ten-year population gain in U.S. history.
You may need to download the Flash Player. View the non-Flash version of New York Bay and Harbor (TIF 86.5MB).
As the population of New York City grew, the infrastructure of the city also grew. This growth is reflected in this nautical chart from 1910, on which new buildings, roads, and many other features appear for the first time in this collection. For example, the chart shows the location around the Harbor of life-saving stations; lights, including the color of associated structures, height above sea level, visibility in nautical miles, and whether a fog signal is present on the light; and storm warning displays around the harbor, provided by the U.S. Weather Bureau (the predecessor to NOAA's National Weather Service). This chart also depicts the height of bridges above sea level—another indication that the city was growing. The Coast Survey responded to increased growth by adding features to its charts, such as bridge clearance, to ensure safe navigation.
Historic Reference
An interesting note on the chart reads: "A Time Ball is dropped from the Western Union Building...at Noon." This note is in reference to the use of time balls to set ship clocks. In the early 20th century, ship captains needed extremely precise clocks to coordinate their celestial readings with the time those readings would occur at a known point (usually Greenwich, England). Beginning in 1877, a time ball atop the Western Union Building in New York City was dropped each day at noon following a telegraphic signal from the Naval Observatory (in Washington, DC). When the signal would drop, mariners would see it and could precisely set their chronometers.
- Chart title: New York Bay and Harbor
- Author: Coast and Geodetic Survey
- Year published: 1910
- Scale: 1:40,000
- Material: Paper
- Printing technology: Copper plate lithography
- Hydrographic survey technology: Lead-line
Related Web Sites
Office of Coast Survey: Historical
Map and Chart Collection
Works Consulted
U.S. Naval Observatory. (1999). U.S. Naval Observatory installs newest Washington time ball. Retrieved June 20, 2006, from: http://www.usno.navy.mil/ballrel.html.
Wendell Cox Consultancy. (2001). Demographia: City on a hill. Retrieved June 20, 2006, from: http://www.demographia.com/db-nyc2000.htm.
(top)