
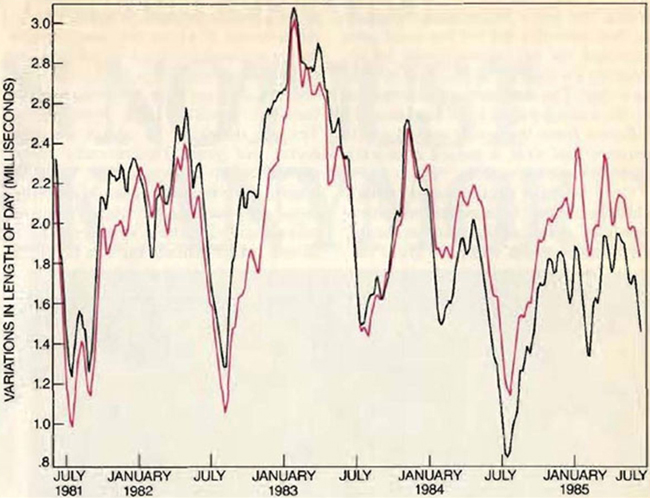
Plot of variations on the length-of-day determined from VLBI (black line) and the change in atmospheric angular momentum (red line). The strong correlation between the two plots shows that the changes in the length-of-day are largely explained by exchanges in angular momentum between the atmosphere and the crust of the Earth. The largest length-of-day value, in early 1984, was associated with an unusually strong El Niño.