There and Back Again: Old Tsunami Data Come Full Circle
NOAA operates National Data Centers for climate, geophysics, oceans, and coasts. Through these Data Centers and other centers of data, NOAA provides and ensures timely access to global environmental data from satellites and other sources, provides information services, and develops science products.
- Introduction
- Riddles in the Data
- The Early Years
- A Fellowship of Scientists
- The Return Journey
- The Adventure Continues
December 25, 2004. Christmas Day. No one is thinking about tsunamis. Most people do not know what a tsunami is, or how to pronounce the word.
December 26, 2004. 7:59 a.m., local time (Indonesia). An underwater earthquake, with an epicenter off the west coast of Sumatra, generates a tsunami that causes more casualties than any other in recorded history. Nearly 300,000 people are killed or listed as missing and presumed dead. Tsunami waves began striking the coasts of northern Sumatra and the Nicobar Islands at 8:15 a.m.
December 27, 2004. People who live on coasts all over the world wonder, “Can it happen here?”

The 2004 Indian Ocean tsunami hit Koh Pu, Thailand. Click image for larger view.
NOAA scientists at the Pacific Tsunami Warning Center in Hawaii went into action within minutes of hearing the alarm triggered by the seismic signals. It was Christmas Day at 3:07 p.m., local time (Hawaii). NOAA issued the first tsunami bulletin seven minutes later, at 3:14 p.m., indicating no threat of a tsunami to Hawaii, the west coast of North America, or to other coasts in the Pacific Basin. This was the geographic area served by the existing tsunami warning system.
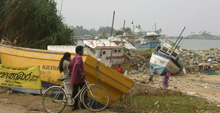
Damage on the coast of Sri Lanka was extensive following the 2004 Indian Ocean tsunami, which originated 2,000 miles away. Click image for larger view.
NOAA scientists worked to notify countries outside of the Pacific region about the possibility of tsunamis. They would not know until later that one minute after their first warning, the first of the tsunami waves reached Indonesia.
In the days and weeks following the disaster, humanitarian aid was the focus of the world. It was time to assess losses and rebuild lives. In the background, however, another effort by NOAA was just beginning...
Riddles in the Data
The 2004 Indian Ocean tsunami, the deadliest in recorded history, created an urgent need to expand tsunami warning capabilities to every coastal nation. Scientists all over the world were asked to assess tsunami risk in their regions. Fortunately, regional data collected about coasts, oceans, bathymetry, engineering, seismic events, and sociology can be integrated in a meaningful way, thanks to great new technologies. There is an abundance of recent, digital data ready for use.
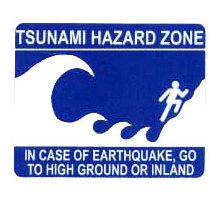
The official tsunami sign used for public awareness on roads in Pacific coastal areas.
However, scientists also need to analyze the long-term history of worldwide tsunami events. Having historical information about tsunami events that go back several centuries would provide the record of past tsunami behavior that was essential to making predictions about the future.
Very little of these historical data are in digital format. In fact, much of the historical record has not yet been found.
Where are these historical data collections? What happened to them?
NOAA’s National Geophysical Data Center (NGDC) has set out to find them. The information will be included within one of NOAA’s treasures—the Global Tsunami Database.
The Early Years: The Creation of Digital Databases
In the 1970s, creating a digital database required keypunch machines and punch cards. Each line of data was carefully typed onto a punch card with space for 80 characters. Hitting a wrong key meant starting over with a new punch card. It was a frustrating process. Only high-priority data were keypunched. The focus of early digitizing was on recently collected data. Older data were low priority.
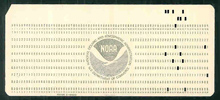
In the 1970s, computers read information from punch cards, such as this one. A punch card is a heavy paper card with holes representing alpha-numeric characters. Click image for larger view.
Using this tedious method, NGDC in Boulder, Colorado, established its first digital global “Significant Earthquake Database” in the mid-1970s.
Scientists at NGDC keypunched data such as location, magnitude, deaths, and damage from printed earthquake histories available locally from NOAA, the University of Colorado, and the U.S. Geological Survey. Occasionally, scientists found information about a tsunami event in earthquake histories. From these data, a separate Global Tsunami Database was created in the early 1980s. At that time, the tsunami database focused on significant events that produced great damage and loss of life and generally did not include information on smaller events. The tsunami database was second in priority to the earthquake database.
As computer technology advanced in the 1980s, it was time to remove bookshelves to make room for new equipment. Only current seismology texts were kept in offices. Sometimes old paper records were microfilmed. But in general, books and microfilm media were boxed up and put in warehouses or sent elsewhere. These records had not been digitized. Their contents were not a high priority at the time.
It was a circle of activity that had occurred before. Old things make way for the new...
A Fellowship of Scientists: The 19th Century Collections
Throughout the 19th century, members of esteemed scientific societies came together to share their latest discoveries. These meetings were held every couple of years at universities in large European cities such as Paris, Rome, London, and Brussels. Presentations at these meetings were diverse, covering everything from meteorology, seismology, anthropology, archeology, magnetism, and more.
In the year following each meeting, the collected lectures became available as hardbound books. Additional tables of measurements, diagrams, and details of experiments were added to the text before printing. Handwritten log books from mariners, expeditions, and observatories were also published. These were the data catalogs of their time and became the building blocks for further research in many scientific disciplines.
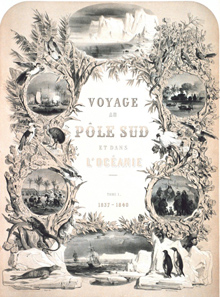
The frontispiece of a book, published in 1842, about the South Pole. Click image for larger view.
Printing these materials was very expensive and time-consuming. Before the advent of the linotype machine in the late 1800s, every letter of a document was handset before each printing. Binding was an additional cost and was often done by hand. Very few of these documents were printed, and distribution was generally limited to the universities or societies that sponsored the research—a very small fellowship of scientists. Thus, very few researchers had access to the data in these documents.
As more conference journals were published, library shelves had to be cleared to make room for them. Eventually, older documents ended up in library basements, also known as “morgues.” If the books were not accessed, they were sent to other universities or boxed and forgotten. Many of these forgotten documents began deteriorating in morgues across the world.
These are the books and journals that NOAA is hoping to find, as some of these documents will have clues to historic tsunami events.
The Return Journey
Following the 2004 Indian Ocean tsunami, there was a new urgency to find tsunami data tucked away in those old documents. The information could help in regional risk assessment and tsunami mitigation.
It became important to delve deeply into the old volumes again, if they could be found. Some of these documents were in climate-controlled rooms at the NOAA Data Center, but most had been redistributed elsewhere long ago. Fortunately, NOAA has an extraordinary library system that searches out these rare documents and requests them through interlibrary loans.
These documents from the late 19th century and early 20th century have come to the NGDC in many languages and many formats. Within the flowery wording of those times is solid information that is important for today’s tsunami researcher. The clues are not only in the numerical data such as latitude and longitude of events, but also in text descriptions.
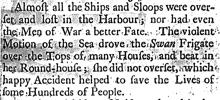
Excerpt from a book published in 1740, describing the 1692 tsunami at Port Royal, Jamaica. Click image for larger view.
To preserve these precious documents, NOAA’s National Geophysical Data Center makes copies of each document and then returns them through the NOAA library system. The information in these documents is analyzed and, if relevant, incorporated into the database. The long journey of these documents is essential to the richness of the Global Tsunami Database.
The Adventure Continues
In the 21st century, NOAA has new scientific challenges that require both new and old data. Historical records compliment the instrumental data that NOAA collects every day to create a complete picture of what happens during a tsunami event.
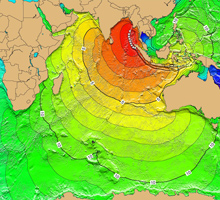
Tsunami travel time map for the 2004 Indian Ocean tsunami. The number tags represent hours after the initial event. Models use quality-controlled source data, integrating many data sets together. Click image for larger view.
Instead of using computer punch cards, digital scanners are used; however, human discernment is still required. Today’s data management also includes metadata—data about the data—which helps researchers to find what they are looking for. Metadata records must be carefully organized so that future scientists do not have to reinvent the wheel.
The science of today depends on, and honors, the legacy of work that preceded it. Printed historical documents that have been sitting on dusty shelves are crucial once more in the adventure of science. This is true in the case of tsunami records as well as for records of weather, climate, and ocean conditions. Each of these pieces of information help to enhance understanding of our planet.
NOAA, through its National Data Centers, collects incredible volumes of data, ensuring that this scientific information is not lost, but is available to those who need it.
Contributed by Joy Ikelman, NOAA’s National Environmental Satellite, Data, and Information Service
