Predicting Hurricanes: Times Have Changed
NOAA's investment in ocean and atmospheric research, coupled with technological advancements, has led to a remarkable transformation in hurricane monitoring and forecasting. Emerging from these combined factors has come intricate computer modeling, a vast network of ground- and ocean-based sensors, satellites, and Hurricane Hunter aircraft. Accurate predictions of storm track and intensity are key to helping NOAA protect life and property.
Viewed from above, hurricanes appear as majestic storms comprised of towering thunderstorms spiraling around an often calm and clear center called an eye. But below the clouds are destructive winds, towering waves, and torrential rainfall. Over water, hurricanes torment ships and can disrupt commerce. Over land, hurricanes cause considerable property damage, unleash flash flooding, and spawn killer tornadoes.
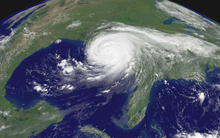
Hurricanes, such as Katrina, appear as swirling masses of clouds when viewed from above; however, these pristine images can be deceiving. Click image for larger view.
Now imagine such a storm striking with little or no warning. A day begins innocently enough with bright blue skies; then, suddenly, it becomes overcast and breezes steadily increase. Howling winds drive sheets of torrential rain while toppling trees, snapping power lines, and destroying homes. Even with advance notification, these are potentially deadly conditions. But, in the not-so-distant past, the absence of an Earth- and space-based detection network allowed hurricanes to make surprise entrances.
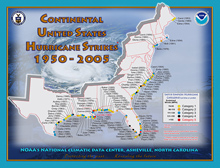
This map shows U.S. hurricane strikes between 1950 and 2005. Click image for larger view.
Knowing where a hurricane will strike and how strong it will be are the fundamental issues that challenge meteorologists, as their decisions impact life-saving preparedness plans by individuals and families and prompt evacuation orders by emergency officials. Advances of the last half-century have brought tremendous improvements in hurricane forecasting and, despite a growing coastal population, have yielded a dramatic decline in hurricane-related fatalities. Today, NOAA uses an arsenal of forecasters, instruments, and computer-based tools to produce the best possible storm projections that extend days into the future.
Limited Warning...Lethal Hurricanes
Hurricane forecasts were once solely dependent upon relatively sparse observations of sky and water conditions, along with occasional ship reports of turbulent weather in the ocean. Attaining the limited data that was available was time-consuming and resulted in hand-drawn maps that displayed only a partial picture of what was actually occurring. Lacking a complete analysis of current weather patterns, in conjunction with insufficient knowledge of tropical meteorology, forecasts for tropical storms and hurricanes were deficient. These limited forecasts left little time for preparation before a hurricane struck.
Without advanced preparation, hurricanes are lethal. On NOAA’s list of the deadliest hurricanes to strike the United States, the overwhelming majority of storms occurred before hurricane prediction reached levels necessary to adequately serve the public.
Among noteworthy lethal hurricanes to strike the U.S. are:
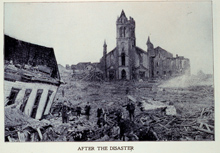
Damage from the Galveston Hurricane of 1900 was caused by the hurricane and resulting storm surge. This was the greatest natural disaster in terms of loss of life in U.S. history. Click image for larger view.
- The Galveston (Texas) Hurricane of 1900, which resulted in a death toll of up to 12,000.
- The Lake Okeechobee (Florida) Hurricane of 1928, which was responsible for at least 2,500 fatalities.
- The Hurricane of 1938, which struck Long Island, New York, and New England with a mere four hours advance warning and left approximately 600 individuals dead.
Times Have Been Changing…
Armed with a greater understanding of a hurricane’s life cycle, along with a more robust automated observation network, today’s meteorologists can produce hurricane forecasts with greater precision. With NOAA’s National Hurricane Center, NOAA’s Central Pacific Hurricane Center, and local National Weather Service forecast offices across the country, NOAA is constantly monitoring the tropics, from Guam in the western Pacific Ocean to the west coast of northern Africa, looking for storms.
Routine hurricane track forecasts for the Atlantic Basin (the Atlantic Ocean, Gulf of Mexico, and Caribbean Sea) began in 1954 and could only provide information one day into the future. Forecasts were expanded to provide two days advance notice in 1961 and three days in 1964. Three days remained the standard for advance hurricane forecasts through 2002.
In 2003, boosted by the reliability of computer models, NOAA began issuing forecasts out to five days in advance. In addition to helping the public and local officials prepare for impending hurricane landfalls, this recent forecast extension helps the U.S. Navy ensure ships are safely removed from a storm’s path.
Tackling Katrina
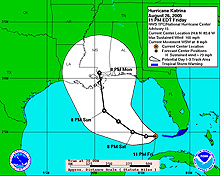
Southeast Louisiana remained in Katrina's projected landfall from the National Hurricane Center for a full 56 hours prior to the storm coming ashore near Buras, Louisiana, at 6:10 a.m. CT on August 29, 2005. Click image for larger view.
The forecasted track of Hurricane Katrina is one example of NOAA’s modern-day forecast accuracy. As Katrina entered South Florida as a newly upgraded hurricane, National Hurricane Center forecasters knew the storm’s future path would take it over the energizing warm waters of the Gulf of Mexico before threatening the northern Gulf Coast. For a consistent 56 hours before landfall, the National Hurricane Center predicted the center of Katrina would specifically strike southeast Louisiana as a “major” hurricane.
While hurricanes remain one of nature’s most violent and destructive storms, and modern research strives to further improve the forecast of hurricane track and intensity, long gone are the days of surprise storms that go undetected until it is too late to prepare.
Forecasting Tools: Making It Happen
Achievements in hurricane forecasting are rooted in the growing number and integrity of data collection tools. From buoys in the ocean to land-based radars to Hurricane Hunter aircraft and satellites, these instrument networks are perpetually taking the pulse of the planet and feeding forecasters critical data.
Aircraft
Gathering data from within, above, and around hurricanes are aircraft operated by NOAA and the U.S. Air Force (USAF). Since the first intentional flight into a hurricane approaching Galveston, Texas, in late July 1943, NOAA and the USAF now routinely fly into storms that are a potential threat to the U.S. Onboard radar and dropwindsondes, which are ejected from the plane’s belly to measure a cross section of a hurricane, provide NOAA meteorologists with data of unmatched density.
Satellites
Satellites have greatly improved hurricane forecasting with their ability to provide informative snapshots of Earth. April 1, 1960, marked the first launch of a weather satellite. Since then, satellites have become increasingly mature in their ability to analyze cloud structures as well as read the temperature of ocean surfaces.
NOAA's National Environmental Satellite, Data and Information Service supports two types of satellites: geostationary operational environmental satellites (GOES) for national, regional, and short-range forecasting and polar-orbiting operational environmental satellites (POES) for global, long-term forecasting and environmental monitoring. Together, GOES and POES complete a global weather satellite monitoring system, tracking atmospheric variables such as temperature and providing atmospheric data and cloud images needed to track and understand hurricanes.
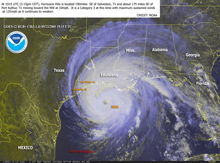
Satellite images, such as this image of Hurricane Rita approaching the Gulf Coast, provide valuable information needed to monitor tropical storms. Click image for larger view.
Weather Radar
Weather radar, first introduced in the late 1950s, underwent a rebirth during the modernization of NOAA’s National Weather Service in the late 1980s and early 1990s. Today, a total of 155 WSR-88 Doppler radars constantly scan the skies over the United States and its territories. Doppler radar reads precipitation intensity and movement and a variety of wind data across a wide column of the atmosphere, providing forecasters with a valuable cross-section analysis of a storm.
Buoys and Floats
Buoys and floats peppered throughout our oceans transmit a variety of valuable data at and below the ocean surface, including air and water temperature, wave height, and wind direction and speed. Operated by NOAA’s National Data Buoy Center, the existing network of buoys is being enhanced with the addition of eight more hurricane buoys in the western Atlantic Ocean, which will allow NOAA to attain more data in an area where hurricanes frequently occur.
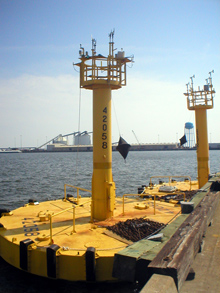
Hurricane buoys before being deployed from Gulfport, Mississsippi. Click image for larger view and image credit.
Computer Forecast Models
All of the observation elements mentioned above, as well as other sensors, provide essential data points that feed NOAA’s computer forecast models, which calculate likely future weather behavior. A more complete, current picture of a hurricane and its environment (the ocean and atmosphere) provided by land-, air-, ocean-, and space-based sensors permits more accurate model projection. The mathematical representation for such computer forecast models is becoming more detailed and can better model a hurricane’s interactions with its surroundings—ultimately producing better forecasts. For example, recent computer model upgrades have featured a better reflection of the “loop current” in the Gulf of Mexico. This narrow ribbon of very warm water can provide hurricanes with added fuel that allows them to strengthen rapidly. The model’s ability to project such intensification is invaluable, as it is detrimental to determining the extent of hurricane evacuations.
Not only has NOAA become proficient in forecasting individual storms, but also the evolving understanding of global ocean and atmospheric patterns has allowed NOAA to produce seasonal outlooks extending through the entire six-month hurricane season (June – November). These outlooks project the number of tropical storms, hurricanes, and major hurricanes (Category 3 and higher) likely to form in each basin that NOAA is responsible for (including the Atlantic Basin and the Eastern and Central Pacific Basins).
Conclusion
Delving through the past shows how far our ability to predict hurricanes has come. With further improvements on the horizon led by an increasingly dense network of observations and sophisticated computer models, NOAA seeks to produce forecasts with even greater specificity. Working with the media, partner organizations, and emergency officials and through enhanced outreach, NOAA aims to educate the public on taking proactive measures to lessen the impacts of hurricanes.
Whether NOAA is forecasting an above-average hurricane season, similar to the record-setting 2005 season with 28 storms and 15 hurricanes, or a below-average season for a given year, the fundamental advice remains the same: be prepared. For it only takes one storm to hit your neighborhood for it to be a bad season.
After all, it may not be a matter of if a hurricane will strike; but rather a matter of when.
Works Consulted
Hughes, P. (1976). American Weather Stories. Washington: U.S. Department of Commerce, National Oceanic and Atmospheric Administration, Environmental Data Service.
NOAA. (2005). NOAA deploys seven new hurricane buoys. Retrieved January 22, 2007, from: http://www.noaanews.noaa.gov/stories2005/s2458.htm.
Sheets, R.C. (1990). National Hurricane Center: Past, Present and Future. Weather and Forecasting, 5, 2. Retrieved January 22, 2007, from: http://ams.allenpress.com/perlserv/?request
=get-abstract&doi=10.1175%2F1520-0434(1990)
005%3C0185%3ATNHCPA%3E2.0.CO%3B2.
