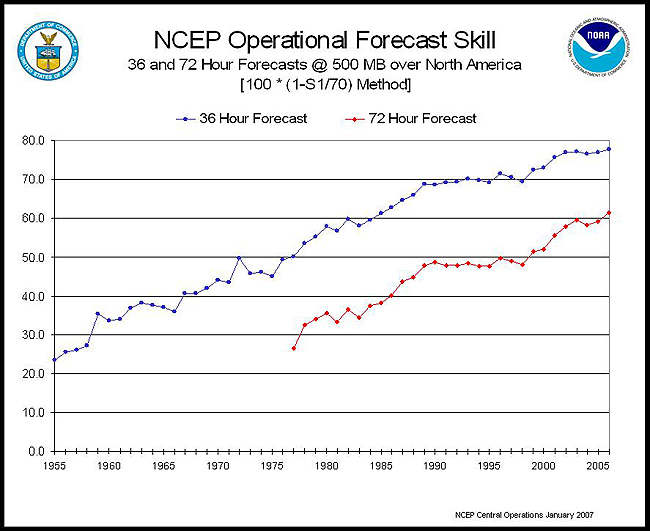
This graph shows computer power and time versus model accuracy as defined by the S1 score (a measure of the skill of the forecast) of 36- and 72-hour NCEP 500-millibar forecasts.
High resolution available. (145KB, 887x724).
With the NOAA 200th Celebration coming to a close at the end of 2007, maintenance of this Web site ceased. Updates to the site are no longer being made.

This graph shows computer power and time versus model accuracy as defined by the S1 score (a measure of the skill of the forecast) of 36- and 72-hour NCEP 500-millibar forecasts.
High resolution available. (145KB, 887x724).